Time Series Data Service FAQs
Everything you every wanted to know about the Time Series Data Service and how to use it.
Basically, the User Management Service regulates the access rights to Proficloud.io. In the Time Series Data Service, these basic rules can be supplemented with additional rights assignments at dashboard or dashboard group level.
Out of the box, every user has access to all dashboards based on their role in the User Management Service. In other words, a user who is in an organization as a viewer will only see the data in the dashboards to which they have access through the User Management Service. As a viewer, they can view the data, but cannot make any changes. However, they can change settings such as the time period shown.
In the Time Series Data Service, it is possible to give a user access to entire dashboard groups or to individual dashboards in the “General” folder.
If user A has view rights to dashboard group 1, he can view all the dashboards in it, but cannot change them. User A can also be granted edit rights to another dashboard group and can therefore also change the dashboards (but always within the scope of the User Management Service; they do not have access to any other devices in the Time Series Data Service that they do not also have access to in the Device Management Service).
How to grant access to a group
- Navigate to all available dashboards
Either via this link: https://tsd.proficloud.io/dashboards or via the four squares on the left-hand side by clicking on “Manage” - Click on the group whose access rights you want to change
- You can now click on the “Permissions” tab
- If you want to grant certain people access to this group, first remove the “Editor” and “Viewer” roles. As an admin, you still have access to this group, but no one else will be able to see this group for the time being.
- Click on “Add Permission”
- Where the default value is “Team”, select “User”
- In the adjacent field, you can see all available users by clicking on the field.
- You can now select the rights to the right of “Can”. These are explained in the drop-down menu.
The rights that you distribute at group level are inherited by the dashboards that are in this group.
How to grant access to dashboards
Special access rights can be assigned to dashboards that are in the “General” group. Dashboards in other groups are defined by the group access rights.
- Navigate to all available dashboards
Either via this link: https://tsd.proficloud.io/dashboards or via the four squares on the left-hand side by clicking on “Manage” - Open the desired dashboard whose access rights you want to set.
- Click on the cogwheel in the top right-hand corner
- Navigate to the “Permissions” entry
- If you want to grant certain people access to this dashboard, first remove the “Editor” and “Viewer” roles. As an admin, you will still have access to this dashboard, but no one else will be able to see these dashboards for the time being.
- Click on “Add Permission”
- Where the default value is “Team”, select “User”
- In the adjacent field you can see all available users by clicking on the field.
- You can now select the rights to the right of “Can”. These are explained in the drop-down menu.
- Now save the dashboard to make the new access rights effective.
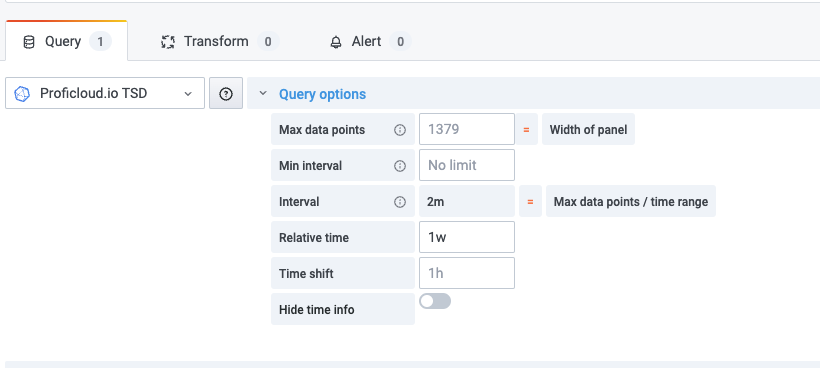
It is not possible to select two or more time periods with the main data picker in the top right corner. If you want to show different timeframes you can use the “Relative time” functionality in the query builder.
Different settings for the relative time
now-1h (Last hour)
This query selects data recorded in the last 60 minutes before the current time (Now).
now-6h (Last 6 hours)
This query selects data recorded in the last 6 hours before the current time (Now).
now-1d (Last day)
This query selects data recorded in the last 24 hours before the current time (Now).
now-7d or now-1w (Last week)
This query selects data recorded in the last 7 days before the current time (Now).
now/M (Current month)
This query selects data recorded in the last 30 days before the current time (Now). Note that this is an approximation for the current month, as months have varying numbers of days.
now/Y (Current year)
This query selects data recorded in the last 365 days before the current time (Now).
Now-1y (Last year)
This query selects data recorded in the year before the current time (Now).
d (Days), h (Hours), m (Minutes), and s (Seconds) as units:
You can also specify precise time ranges in days (d), hours (h), minutes (m), and seconds (s). For example, “Now-2d” would select data from the last 2 days before the current time.
Using relative time ranges allows you to dynamically respond to changes over time without manually adjusting queries. These relative time notations are particularly useful when visualizing real-time data or quickly switching between different time ranges.
Video on how to take a look at all months of 2023 in one dashboard
avg()
This calculates the average (mean) value of the data points within a given time window. For example, if you have temperature readings every minute, you could use avg() to find the average temperature over the last hour.
min()
This gives you the smallest value in the data series during the specified time window. If you’re monitoring server response times, min() would give you the lowest response time within a certain period.
max()
On the other hand, this function gives you the largest value in the data series within the time window. For instance, you could use max() to find the highest CPU usage over the past day.
sum()
This function adds up all the values in the data series within the specified time range. If you’re tracking the total data transferred by a network device, sum() would give you the cumulative data transfer in a specific time period.
count()
This simply counts the number of data points within the chosen time frame. It’s useful if you want to know how many events occurred within a certain time period, like the number of logins in the last 15 minutes.
last()
This gives you the value of the most recent data point in the selected time range. If you’re monitoring a sensor that reports its status, last() would provide the latest status update.
median()
The median is the middle value in a sorted dataset. It’s useful when you want to find the central tendency of your data while being less affected by extreme values, unlike the mean. For instance, you might use median() to find the median response time of a web server.
diff()
This calculates the difference between consecutive data points in the time series. It’s helpful for tracking how much values change from one point to the next. If you’re measuring the number of new user sign-ups, diff() could tell you how many new sign-ups happened in each time interval.
diff_abs()
Similar to diff(), this calculates the absolute difference between consecutive data points. It’s like taking the positive value of the difference, so negative changes become positive. Useful for tracking changes regardless of direction.
percent_diff()
This calculates the percentage difference between consecutive data points. It’s a relative measure of change and can help you understand the magnitude of changes in your data.
percent_diff_abd()
Like percent_diff(), this calculates the absolute percentage difference between consecutive data points. It’s useful for understanding relative changes without considering the direction.
count_non_null()
This counts the number of non-null (non-missing) data points within the chosen time range. It’s useful if you want to know how complete your data is during a specific period.
A
A = name of your query. You can also give it a more speaking name in the Query area of the panel.
5m,now
The Time Series requires you to have a period of time to evaluate if alerts need to be sent. This time period is the period over which you want to do calculations on, which is why many conditions have aggregate functions like AVG, MAX, DIFF, LAST, etc.
So, when we say Query(A, 5m, now), it means that we evaluate the alert rule on Query A from 5m ago to now. You can also set alert rules that say Query(A, 6m, now-1min) to account for a lag in data being inserted in your data source or network latency.
This is important, because if an alert condition uses Query(A, 5m, now) and there is no data available for now, NO DATA alerts will fire (i.e., there isn’t any data with which to evaluate the rule).
You’ll want to select a time interval to evaluate your aggregate function that’s greater (longer) than the time period in which you add new data to the graph that’s triggering your alerts.
Example: We scrape the database every 10 seconds. If we set an alert rule like Query(A, 5s, now), we’d end up getting NO DATA alert states constantly, because our data is not that fine grained.
If an alert rule has a configured For and the query violates the configured threshold it will first go from OK to Pending. Going from OK to Pending the Time Series Data Service will not send any notifications. Once the alert rule has been firing for more than For duration, it will change to Alerting and send alert notifications.
If you are sending 1/0 (boolean) values to Proficloud.io, you might face the situation, that in the Time Series Data Service you will get a 0.625 value instead of a 0 or a 1. You want to display either 0 of 1, that’s why the “mean” value of a metric is not the right setting.
You need to change the value of your metric to “last”. You can do this as shown in the video below.
- Open the dashboard with the graph panel that displays your boolean data
- In the row “SELECT” remove the “mean()” value
- Click on the “+” on the “SELECT” row and navigate to “Selectors” and click on last
- Open dashboard
- Click on [+] to add a new panel
- Blick on [Add an empty panel]
- Select the Imagelt visualization
- Copy the URL of the image you want to include in your dashboard
- Insert the URL into the input field “Image URL” in the display options
- Optional: Remove the background of the panel by selecting “Transparent” in the general settings of that panel
- Optional: Remove the panel title to have a standalone image
- Change the datasource to — Grafana — to remove the red error triangle at the top left area of the panel
- Open the dashboard you want to set as your home dashboard
- Mark it as favorite in the top bar of the dashboard
- Go to your settings (profile icon at the bottom left corner) and click on “preferences”
- Scroll down to the Home Dashboard area
- Select your new starred dashboard
Prerequisites: The devices to be displayed in the map must have a location in the Device Management Service.
- Create a dashboard
- Adding the “Proficloud.io DMS Plugin” plugin
- Copy the UUID of the device that is to receive an individual link
- Scroll down in the right column and click on “+ Add link”.
- Inser UUID
- Name link
- Enter link destination (other URL, or URL of another dashboard)
- Save dashboard
Unfortunately, it is currently not possible to store a variable or a query as a Y-MAX value in the graph visualization. However, it is possible to achieve the same effect by using an invisible query that has the maximum value. This way the Y-axis is always set to the maximum of the query. The video below shows how this works.
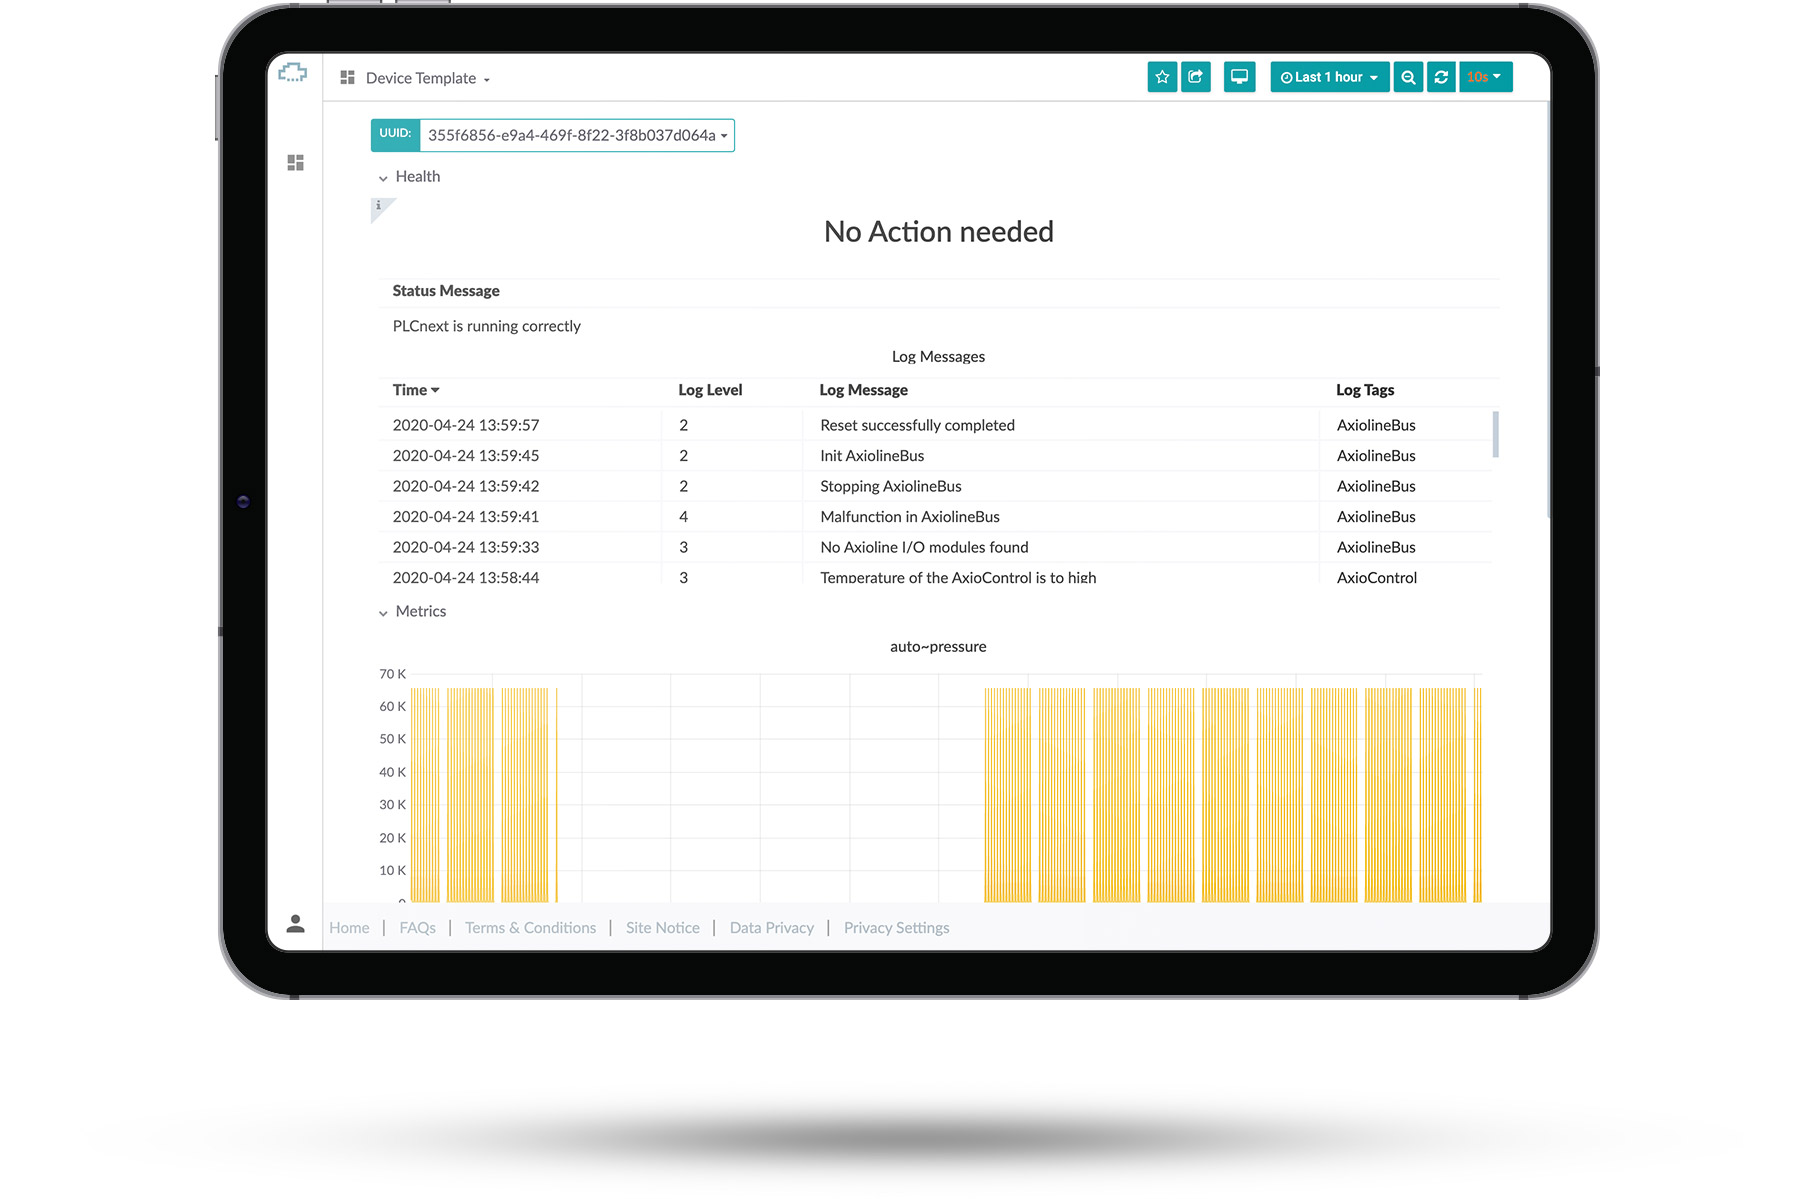
You can see an overview of the different default templates we currently offer.
Select one of them to see what they look like. After you’ve selected a dashboard you can change the UUID of the device you’re looking at in the top left corner.
There you can see basic information about your devices and check if they are running. These premade templates can’t be edited or removed.
This article contains:
Select data
Select visualization
General options
To get started with creating your own dashboards, please click the small user icon in the bottom left corner, click the “Switch” button and then press the small “switch to” button right behind your email address.
From that point on, you’ve switched to your personal organization, which allows you to create your own private dashboards, which only you can access.
Once you switched to your own organization you can create new dashboards by selecting the [+] button in the left sidebar. This will create an empty dashboard.
A dashboard consists of panels, which can be arranged in a number of ways. A new panel can be added to the dashboard by clicking the [Add Panel] at the top of the screen.
Select data
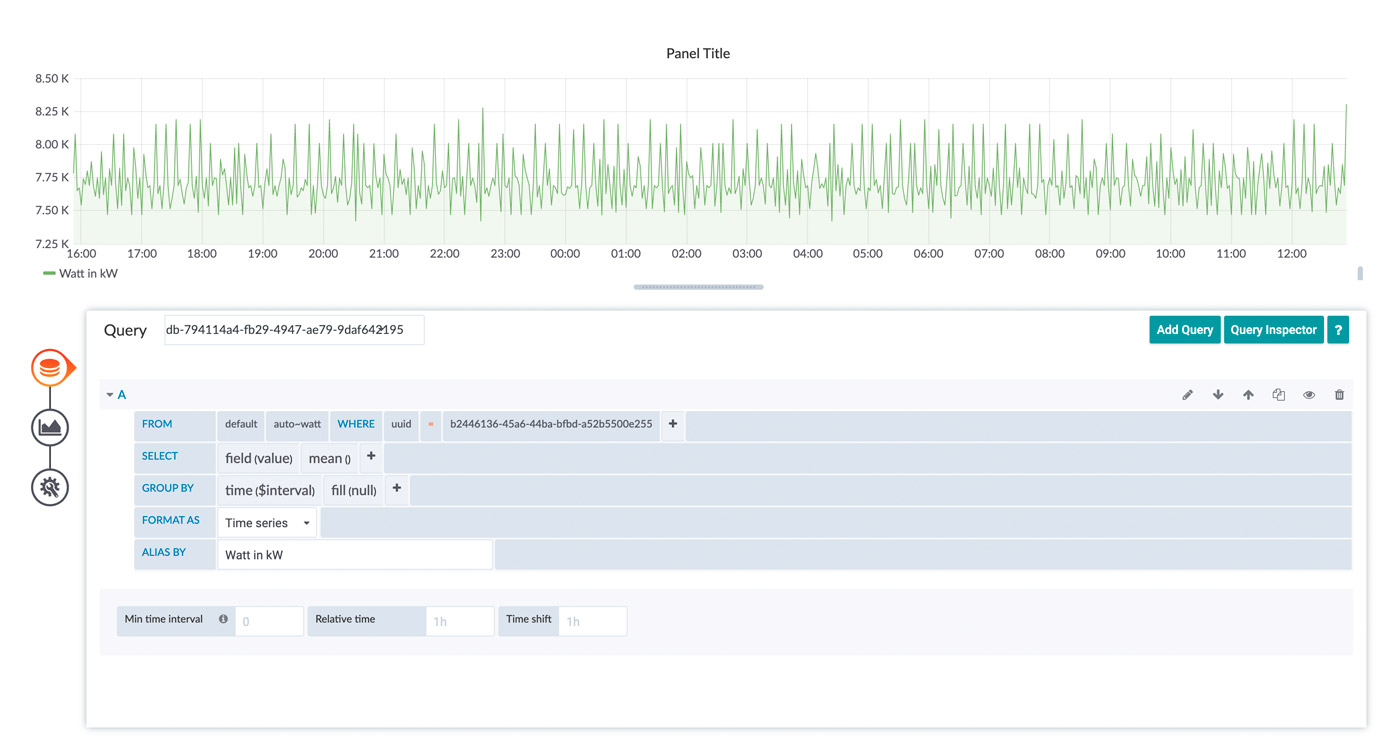
To retrieve data from your devices you must create a query. The query is sent to our cloud databases and provides you with the resulting data.
There is a graphical helper you can use to built your query in a point-and-click fashion.
- Click on [+] symbol on the left side of your screen, then on [Dashboard]
- Click on [Add Query] to start creating your new dashboard
- Select your data source from the dropdown right next to “Query”
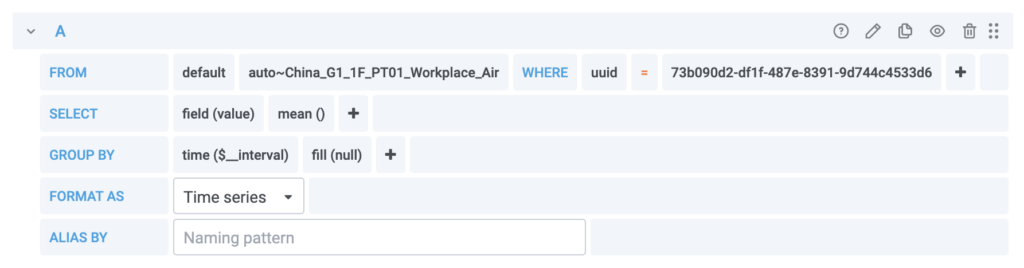
- Build your query using the graphical editor
- Start by selecting a UUID in the “FROM”-row with clicking on the [+] right next to “where”
- Now select one of your UUIDs with a click on [select tag value]
- In the “FROM”-row, click now on [select measurement] so select what data should be displayed in your dashboard
- In the “SELECT”-row you now can change the field of the data inside the graph with clicking on the [+] next to “mean”
- In the “GROUP BY”-row you can set the interval of the data inside the graph
- You can give your data a new alias, with typing in a name in the row “ALIAS BY”
- If your data is written in a smaller frequency than in the “GROUP BY”-row, you can set it here
If there is anything wrong with your query, check the red exclamation mark at the top left of your panel
This is the easiest way of visualization, what you select depends on what you want to see. The best way to learn how the methods work is to try them out.
Select visualization
Click on the graph at the left side of the panel you worked with so far
This tool enables you to personalize the graphic. Click on the box [Graph] next to Visualization
Now you could choose which visualization you want to have for your measurement. There are a few visualization options that can be chosen from. It should be noted that not every visualization is suitable for every type of data.
What you see depends on what you select. The best way to learn how the methods work is to try them out.
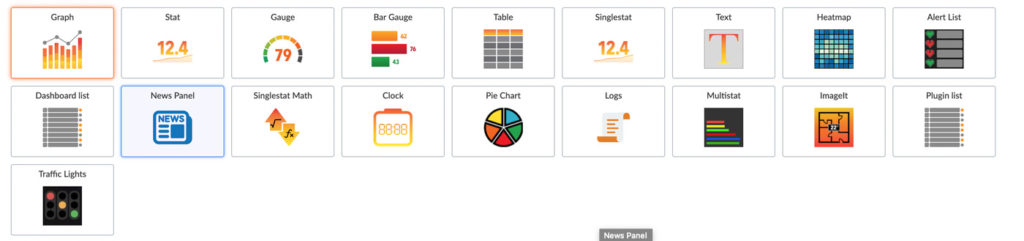
You can also add new visualization option using plugins or remove old ones you don’t need.
After Choosing a Visualization you can edit it to the extend you need to. Every Visualization has different settings ranging from changing the name to visualizing your data in different ways.
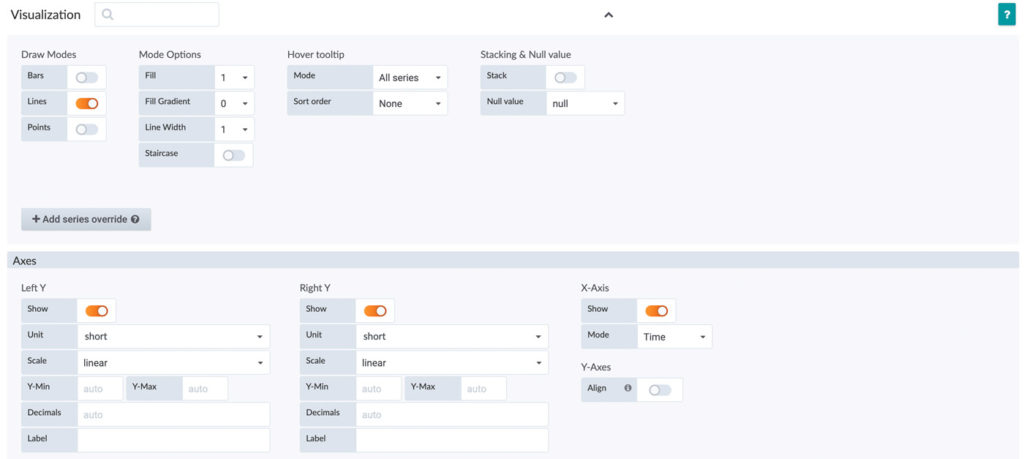
As an example, here you see the options for the Graph Visualization.
Now you can edit the visualization to the format you need. You could change the “Draw Mode” from Line to Bar, fill gaps with data, change the unit or scales of axes.
Just by trying the different type of options, you should get a greater understanding on how to make dashboards and personalize them.
General Options
In the box next to “Title” you can select the name of your Panel.
The option “Transparent” gives you the choice between a transparent and a nontransparent panel.
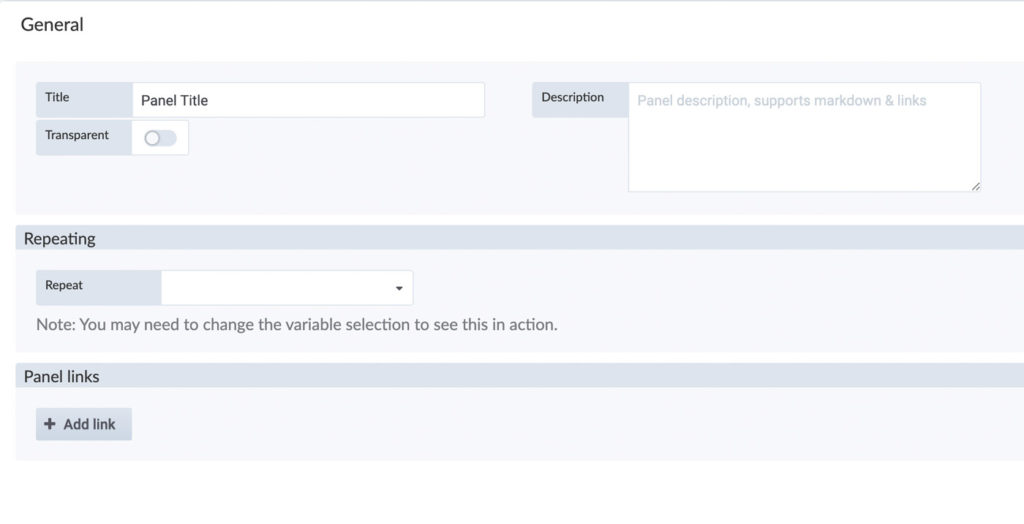
If you want, you can add a description, it supports markdown and links.
Exporting data from the Time Series Data Service as a CSV file is very simple.
Open any dashboard in which you can find a panel with the corresponding data. If you have not yet created your own dashboards, you can also use the Device Template.
Navigate to the panel with the data (metric) you want to export. Here, click on the name of the panel to open the context menu. Here, click on “Inspect” and then on “Data”.
Here you can export the data as a CSV file. The data displayed will always be exported, so if you want a different time period than the one initially set, you must change the time period before exporting.
The template dashboards can not be modified. Every modification you make here, will be revoked after a reload of the page.
You can export the templates and import them as your own custom dashboard, where you can also apply changes.
Our cloud system delivers data to your browser where the data is rendered and displayed. We limit the maximum number of data points for each query to 20000 points. Please note, that querying more data points for a single query is not providing much information, because your screen resolution likely does not have the resolution to display all of the data anyway. The limitation keeps processing time in the browser in check and results in a more snappy response of the user side.
If you want to view a larger time range, where you would end up with more than 20000 data points, we recommend you have a look at the grouping and aggregation parameters for the queries. Our template dashboards do this by default. You can choose a grouping interval to suit your needs, but it usually suffices to use the “$__interval” range. This will take the selected time range, your screen resolution and size of the panel into account and our database will aggregate the data for you. You can choose different aggregation options through the query editor. The benefit of this is, that the load is shifted to our cloud system and the amount of data which must be transferred to your browser is reduced. This also results in much smaller workload for your browser resulting in a better user experience. Have a look at the following screenshot for an example:

Time Series Data Alerting allows you to receive notifications of certain threshold violations in the Time Series Data Service. You can also receive these messages when you are not actively working in the Time Series Data Service, for example, by email or messenger.
You can create alerts so you get notifications when a certain rule is fulfilled, for example you could get an email when your device’s temperature is above 64 degrees.
- Navigate to the panel you want to add or edit an alert rule for, click the title, and then click [Edit].
- On the Alert tab, click [Create Alert]. If an alert already exists for this panel, then you can just edit the fields on the Alert tab.
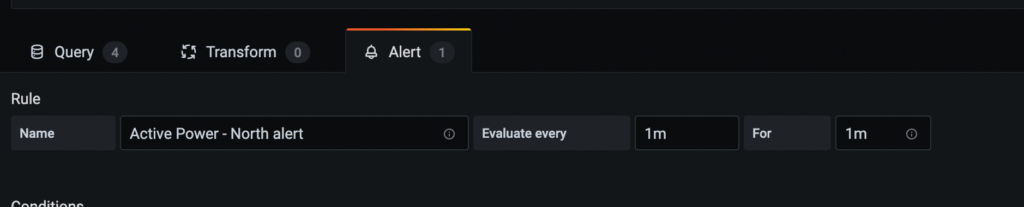
- Fill out the fields.
- Name: Enter a descriptive name. The name will be displayed in the Alert Rules list.
- Evaluate every: Specify how often the scheduler should evaluate the alert rule.
- For: Specify for how long the query needs to violate the configured thresholds before the alert notification triggers
- Now choose your conditions, specify a query
- When: Controls how the values for each series are reduced to a value that can be compared against the threshold. Click on the function to change it to another function.
- Of: Specify a time range. The letter defines what query to execute from the Query tab. “(A,5m,now)” means 5 minutes ago to now. You can also do ”(A,10m,now-2m)” to define a time range that will be 10 minutes ago to 2 minutes ago.
- Is Above: Defines the type pf threshold and the threshold value. You can click to change the type of threshold.
- You can now set the ways of how you want to be notified in the “Notifications” area.
- With a Click on the [ + ] right next to “Send to” you can chose a notification way
- Fill in the message you want to get in case a threshold is violated.
- Tags: Specify a list of tags to be included in the notification
- Navigate to the panel within your dashboard using the appropriate alert.
- Click the name of the panel, and click [Edit].
- Click on the “bell” on the left side of the setting options to get to your configured alerts.
- Click [Delete] in the upper right corner of the setting area.
- Confirm the deletion with a click on [Delete] – The Panel will still be available you are only deleting the alarm.
- Open the Time Series Data Service and navigate to the “Notification channels” with a click on the “bell” in the left side navigation
- Click on [New channel] to set up a new notification channel.
- Here you have to fill in some settings:
- Name: Enter a descriptive name, the name will be displayed when you create a new Alert rule and choose a notification
- Type: Choose how the notification should be sent, for example Email, Slack, Microsoft Teams …
- Default: Use this notification for all alerts
- Include Image: Captures an image and include it in the notification
- Disable Resolve Message: Disable the resolve message [OK] that is sent when alerting state returns to false
- Send reminders: Send additional notifications for triggered alerts
As a reminder you can hover over the “i” symbol to receive more information
(optional): to test if the notification gets send to you click “Send Test” on the bottom.
The times of the data sent by the device must be sent in the UTC format. For this purpose the hardware clock must be set to UTC so that the values get the correct time stamp.
Because the data points that are uploaded have a certain resolution. In the end it’s a group of single data points. You can change the way it’s displayed in the visualization possibilities of the graph. Set Null value on the very right to “connected”.
If the “Evaluate every” and the “For” time have the same value, the alert may not be triggered until after the second cycle. This can be changed if the “For” value is set to a different value (e.g. 30s).
If you want to show average values in the Time Series Data Service, for example, you must specify from which group of data points this should be done. By default, the function is set to “Group by Time Period”, so you can start directly.