What are Heating Degree Days and Cooling Degree Days and how can they be used effectively in Energy Management?
Weather normalization refines energy data analysis—enabling objective, climate-adjusted insights for smarter energy management.
When measuring the energy used for heating and cooling buildings we have a problem: the weather has a large influence on the required energy. This makes it difficult to determine if we improved the energy efficiency, when evaluating energy conversation measures. If we compare the consumption of two years we need a way to clean our consumption from weather effects. Heating and Cooling Degree Days help us to remove weather influences from our data.
What are Heating Degree Days?
Heating Degree Days (HDD) quantify the required heating energy by buildings. HDD are derived from the outside temperature of a building and a threshold temperature. The assumption is that a building has to be heated once the outside temperature falls below a threshold temperature. It counts the time and temperature difference below the threshold as an approximation of how much a building has to be heated.
The threshold chosen varies from country to country. In the EU a threshold of 15.5°C is used, while the the United States use 18.3°C (65°F).
What are Cooling Degree Days?
Analogously to Heating Degree Days, Cooling Degree Days (CDD) are used to measure the required cooling of buildings. The thresholds used differ from the HDD thresholds (e.g. 22°C in the EU) and Cooling Degree Days count the difference above the threshold instead of below. This measurement is mainly used in hotter climates but becomes more important in cooler climates due to rising temperatures.
How are HDD and CDD calculated?
HDD and CDD are often published national weather services (e.g. the DWD for Germany). These can be used if you need official measurements for your region. Alternatively you can also calculate HDD and CDD yourself.
Different methods of calculation can be used yielding results of varying accuracy. In this article three different approaches are presented, from coarsest to finest. Further methods and variations exist but will not be discussed here.
Average Temperature Method
For this method you will need the average daily outside temperature. This can be provided by a weather service or be measured locally. The HDD/CDD are calculated as the difference to the chosen threshold, if the average lies above the threshold. Otherwise the HDD/CDD is zero.
Example: The average temperature of a day is 10°C with a chosen HDD threshold of 15°C. Therefore the temperature is below our threshold resulting in 5 HDD for this day.
With a chosen CDD threshold of 22°C and the measured temperature of 10°C lies below the threshold, therefore the we have 0 CDD for this day.
One variation of this method is to use the minimum and maximum temperature of a day to estimate the average temperature, as used by the US National Weather Service.
Integration Method
The most accurate method to calculate HDD/CDD is the integration method. Instead of using daily aggregate values for each day, we use the recorded temperature data in its full resolution.
For each point of the series the value above/below the threshold is calculated and normalized by the distance to the next data point. The sum of all differences forms the HDD/CDD of the day.
What can HDD and CDD be used for?
Energy Performance Indicators (EnPIs) are key metrics used in Energy Management to evaluate how efficiently a company uses energy. EnPIs can be simple, like total energy consumption, or more complex, involving multiple variables such as energy usage per product produced. For heating and cooling efficiencies, EnPIs often use Heating and Cooling Degree Days to account for weather influences.
Now that we know how to calculate Heating Degree Days, we can use this measurement to analyze our energy consumption. By dividing a building’s energy consumption by the HDD, we obtain an Energy Performance Indicator that is adjusted for environmental effects. This adjustment allows us to compare the building’s performance across different years more accurately.
For example, a building consumed 10,000 kWh of energy in a year with 1,000 HDD, resulting in an EnPI of 10 kWh per HDD. The following year, Building A consumed 12,000 kWh with the same 1,500 HDD, resulting in an EnPI of 8 kWh per HDD. This shows an improvement in energy efficiency although the the building total energy consumption increased due to a harsher winter.
Additionally, if we divide the EnPI by the building’s square meters, we can compare different buildings at various locations. The HDD removes the influence of local weather, while normalizing the EnPI by square meters makes it comparable between buildings of different sizes.
For instance, if Building A is 500 square meters and Building B is 1,000 square meters, and both have an EnPI of 10 kWh per HDD, normalizing by square meters would give Building A an EnPI of 0.02 kWh per HDD per square meter and Building B an EnPI of 0.01 kWh per HDD per square meter. This comparison shows that Building B is more energy-efficient relative to its size.
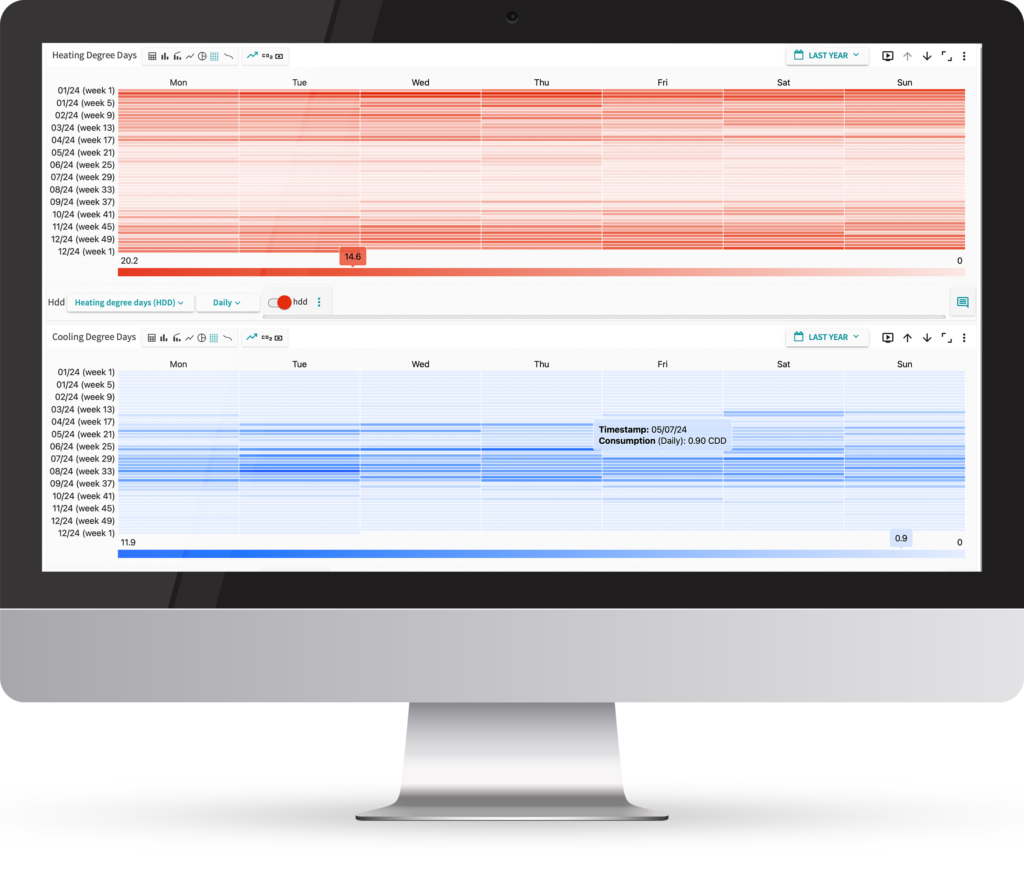
How to use HDD in Energy Management Service
The Energy Management Service has a native support for Heating and Cooling Degree Days. To use this feature you will need a source of providing the Heating Degree Days (or CDD) for your location. This data can either be imported via CSV or be provided by a device, such as a PLCnext Control (AXC F 2152) or a custom device running NodeRed.
If you import the data via CSV, the data can be provided in any temporal resolution. Each line should have a start timestamp and the Heating Degree Days measured since the previous row. The data will be interpreted as Celsius Degree Days.
Upload or import your data as a metric and place it in the buildings metering point in the tree view. Deactivate edit mode for the tree and click on your newly placed metric. This will open a preview of the data allowing you to check it for plausibility.
Next we can create the EnPI/KPI for our building. Go to the “Calculation tab” and click the +-Button to create an new KPI. This will open the Formula Editor. In the formula field type @ to reference a metric and select the heating energy of the building, by typing its name or selecting it from the dropdown menu. Divide this metric by the imported HDD, selecting it same way.
Optionally you can also divide it by the square metre of your building. As this is a static value in most cases we don’t create a metric for this, but add it to the KPI directly, by entering the square metres followed by # to open the unit selection and selection “square metre”.
Finally give your KPI a name and check the unit type in the top right of the dialogue. It should be Energy/HDD, or Energy/(HDDArea) if you included the building size.
Why weather-adjusted metrics matter
Incorporating Heating and Cooling Degree Days into energy management practices allows for a more accurate, weather-adjusted evaluation of building performance. By removing the variability introduced by climate conditions, organizations can better track efficiency improvements, benchmark across sites, and make informed decisions based on reliable, normalized data. This approach not only enhances transparency but also supports long-term sustainability goals through smarter energy insights.