
Time Series Data Service
Diverse visualization options of incoming data, individually tailored to user needs and expandable at any time.
- Highly customizable dashboards with granular permissions
- Built-in alerting for threshold violations
- Possibility to create divisible templates for complex projects
- No limits in display, whether analog or digital data
Contact us so that together we can realize your individual requirements.
All process data centrally available – at any time, from anywhere
The Times Series Data Service enables users to access, monitor, and track process data anytime and anywhere.
Easily configurable and web-based dashboards quickly and precisely visualize all relevant parameters requested by the user, such as the rotation speed of a wind turbine, engine temperatures, flow rates, or reject rates. They form the basis for data-driven decisions and big data applications. Thanks to Proficloud.io, you can use the Smart Service very easily and even with having no own or only limited IT resources!
Transparent view of the key figures recorded by different systems
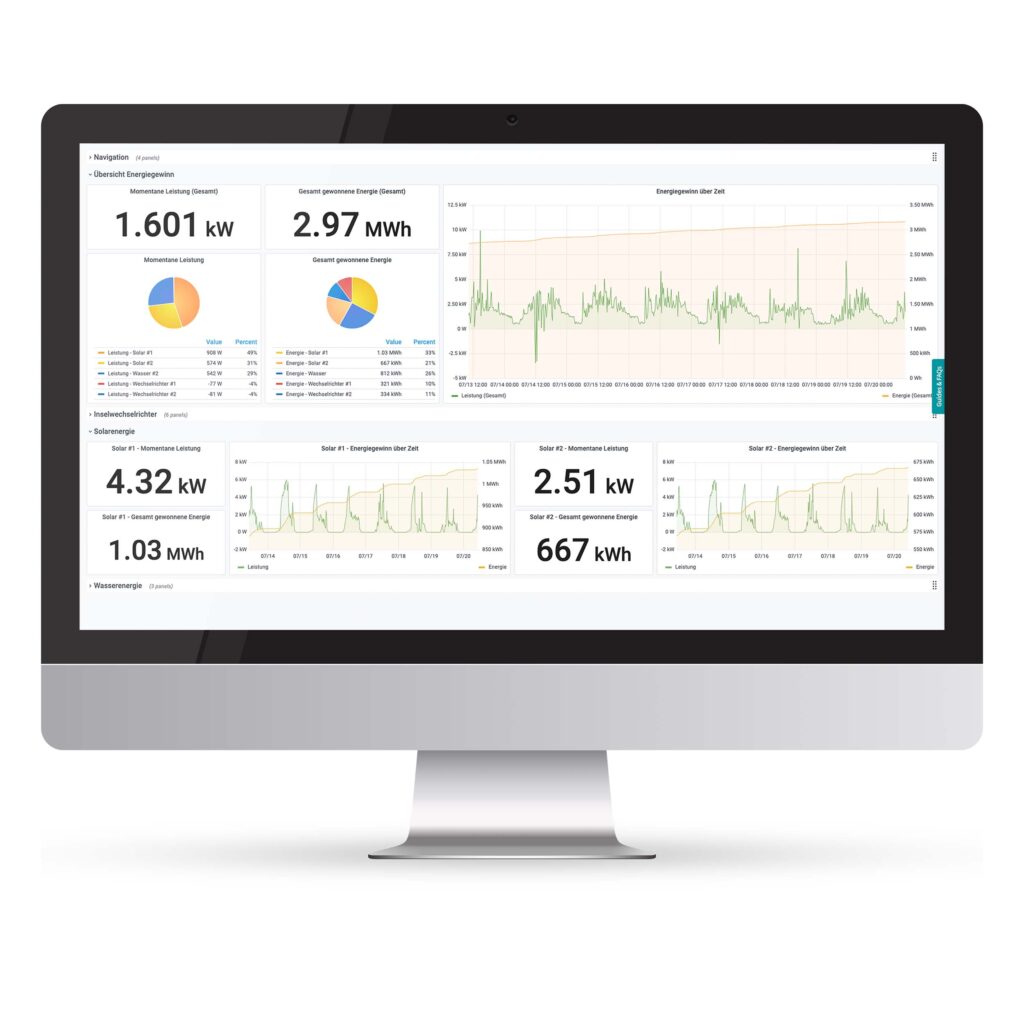
Using the „Graph“ widget allows to easily and effectively display time series data.
The Time Series Data Service enables users to access, monitor, and track process data anytime and anywhere. Easily configurable, web-based dashboards quickly and precisely visualize all relevant parameters requested by the user, such as the rotation speed of a wind turbine, engine temperatures, flow rates, or reject rates.
Save money by switching from reactive to proactive action
Through the widget „Graph“ it is possible to create individual alertings and send them with configured communication channels.
Thanks to automatic built-in alerting manual workflows are reduced with Time Service Data Service. Predictive maintenance is possible. Operations and maintenance tasks become predictable. This saves real time and money.
Use simple systems and expert knowledge about your processes to make them transparent and recordable
The Time Series Data Service provides you with a free opportunity (20 metrics free of charge) so you can see the quality and value of the Smart Service for yourself.
Time Service Data Service offers you a easy access to the world of big data. Thanks to the Plug and Play IIoT platform Proficloud.io connect your devices easily to the cloud and benefit from a ready-to-use IT infrastructure with the highest security standards available.
Time Series Data Service description
Optimize Production Processes
Optimization and efficacy in the value chain is what companies aim for. The Time Series Data Service enables users to access, monitor and track process data. Users are able to access the data from every connected machine, not matter where it is located, and visualize the data. The Time Series Data Service does not stop there, further, users have the opportunity to monitor the data and set customized alerts. Users have a direct insight into the production process and make decision based on actual data.
Shorten downtime and maintenance times
During downtimes companies do not produce any products or adding value to the business. Every producing company aims to reduce the downtime or at least be in control of it. With the Time Series Data Service users now know when downtimes can be expected and maintenances are necessary.
Consistent product, service and process quality
Quality can be determined by many factors, which can also be visualized in Time Series Data Service. These criteria (whether weight, throughput or similar) can be prepared transparently for everyone in the Smart Service. Be informed if your goods do not meet your requirements and ensure that defective goods can be sorted out immediately and do not become a complaint case. Or ensure that e.g. energy peaks can be intercepted by informing you at an early stage.
Accessible expert knowledge
Every company has a small handful of employees who know the production and the machines better than everyone else, often due to long work experience. This knowledge can be made accessible and be shared through the Time Series Data Service. The data is visualized and alerts can be set based on the data.
Excerpt from possible uses
The graph widget
The „Graph“ widget is one of the simplest ways to display time series data.
It allows you to easily display incoming data as curves, bars or points, each of which can be customized in color. The widget also offers a large number of other customization options.
Alertings are also set up in this widget, which makes it one of the most important widgets in the Time Series Data Service.
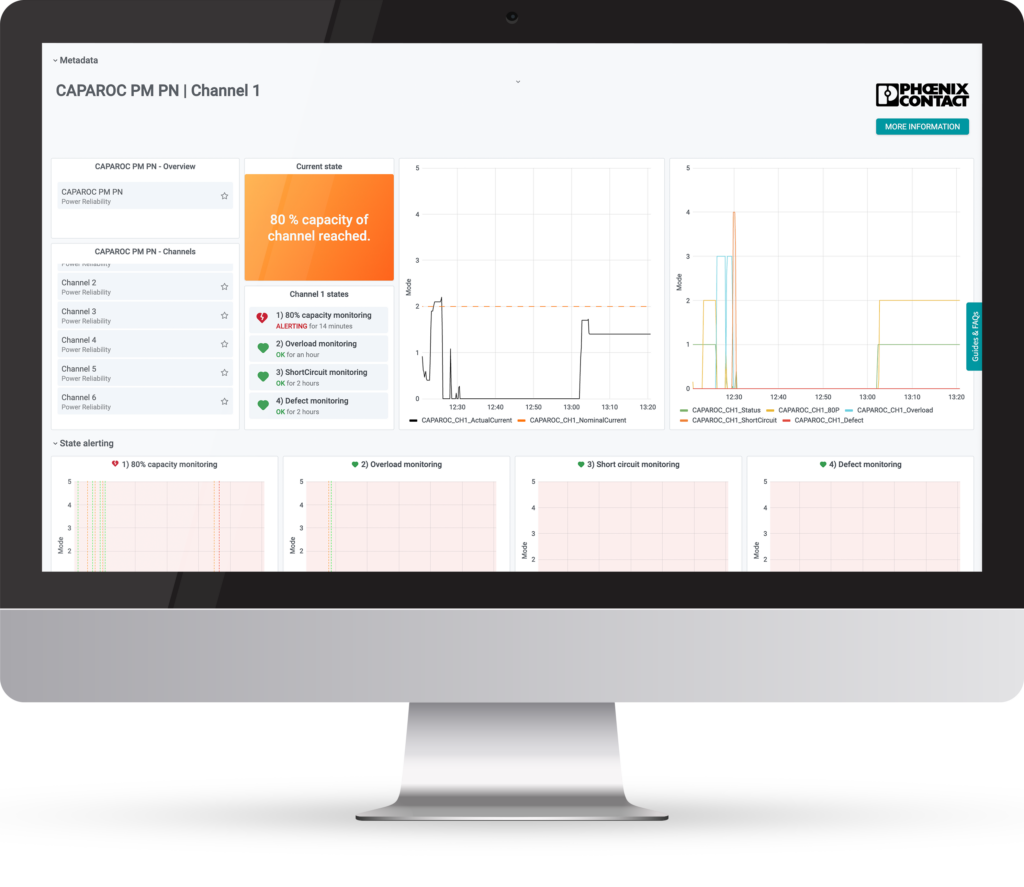
The stat widget
With the widget „Stat“ it is possible to display a certain value (e.g. current, highest, lowest value) of an incoming data flow.
It is possible to add color coding to values below or above a certain value (e.g. up to 80 = green; above 80 = yellow; above 100 = red). The user always has the choice here whether to display the background with a curve of the past data, or only the current value.
In addition to the color coding, it is also possible to create a plain text message from the numbers. This can be configured in the same way as the color coding (e.g. up to 80 = „Everything is running normally, don’t worry“; above 80 = „The machine is slowly running hot, a break will be needed soon if the machine does not cool down“; above 100 = „The machine will shut down soon to prevent damage“). The color coding and the plain text coding can be combined well with each other.
The alert list widget
The Alert List widget shows changes (based on the alerts that have been set up) that would have or did trigger alerts.
This is based on the settings in the alerts (e.g. PENDING = If an alert is set up so that the limit must be exceeded for at least 5 minutes to trigger an alert; OK = If after a PENDING status the limit exceedance has decreased; ALERT = If after a PENDING status the limit exceedance is exceeded for more than the set value).
Thus, the Alert list shows past limit violations in a convenient overview. It is also possible to set whether the alerts should be displayed only from one dashboard or from all dashboards created in the account.

Schedule live demo for the Time Series Data Service
Would you like to see the functions live? With pleasure! We will be happy to show you all the functions directly in live operation, make an appointment today!
Want to see the whole offer? That’s for sure possible as well! Just mention this in the mail and we will work things out.

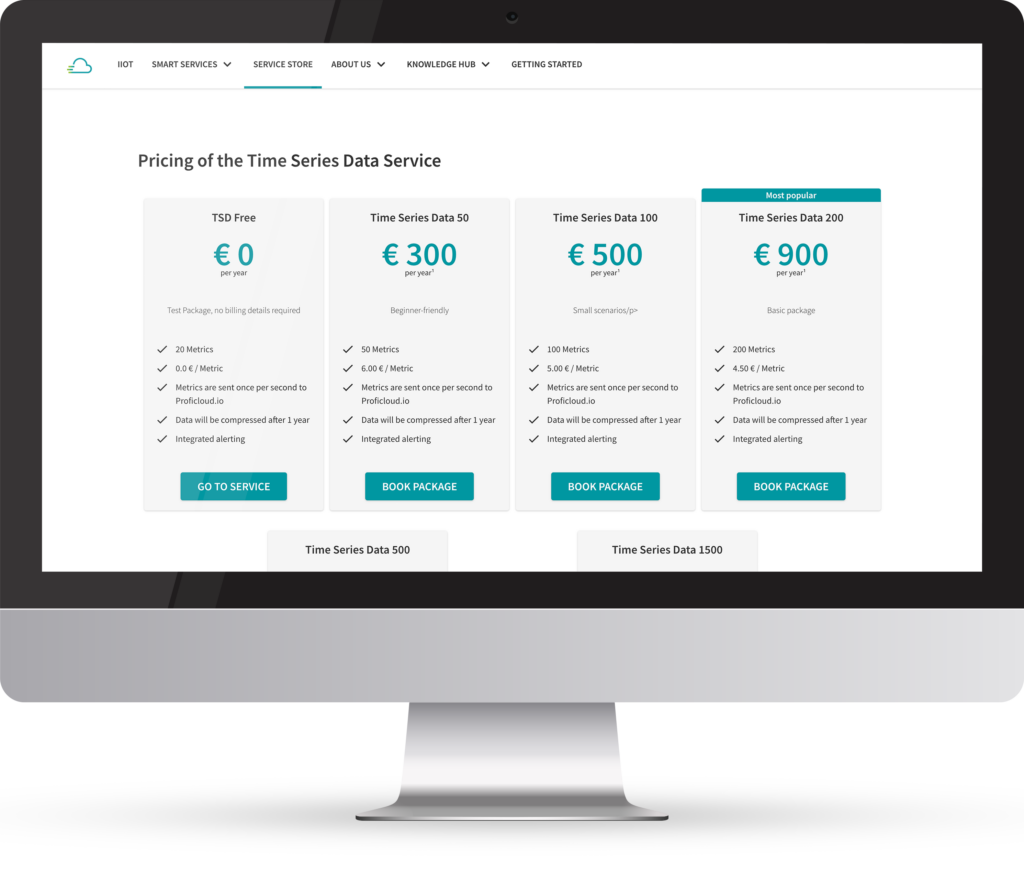
Pricing
Show the Time Series Data in the Service Store for pricing, compatibility and changelogs.
The Time Series Data is a paid Smart Service on Proficloud.io. Licenses can be booked in the Service Store for individual metrics. These are valid for one year and are automatically renewed.
Further information


Hi, my name is Florian Jacob and I am glad to help you out!
Please do not hesitate to contact me. Also, if you have any suggestions or comments, just send us a message to inbox[at]phoenixcontact-sb.io and we will answer as soon as possible.