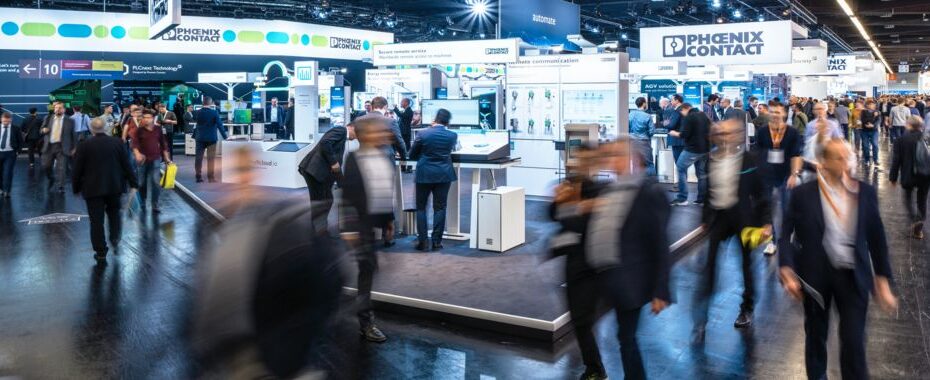
Experience Smart Services Live at the SPS Fair
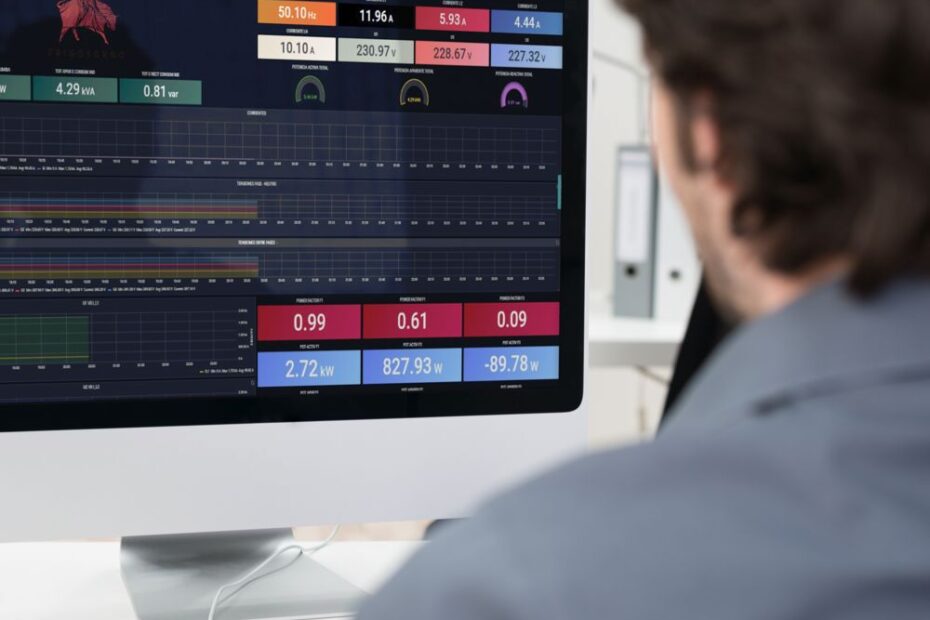
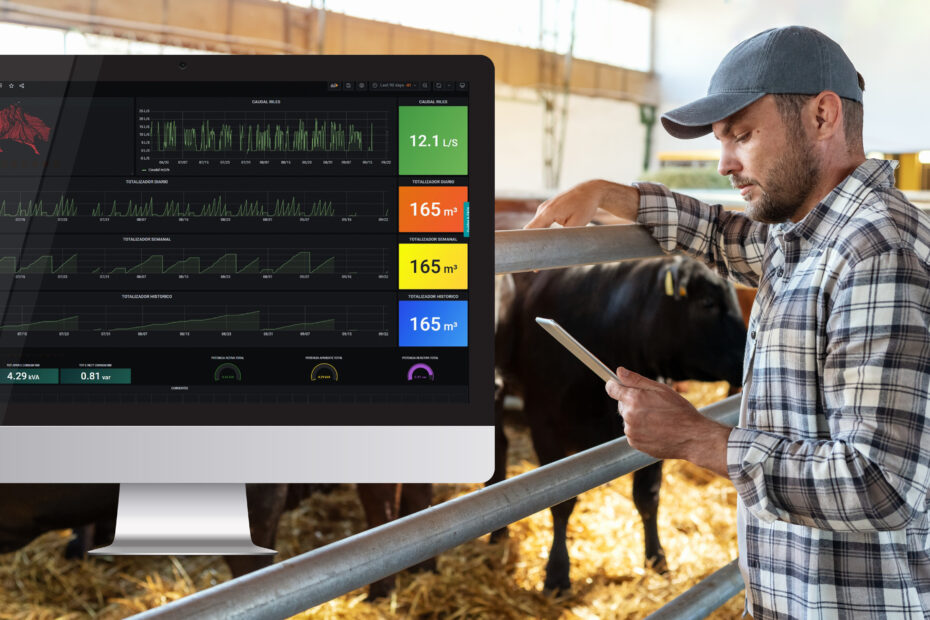
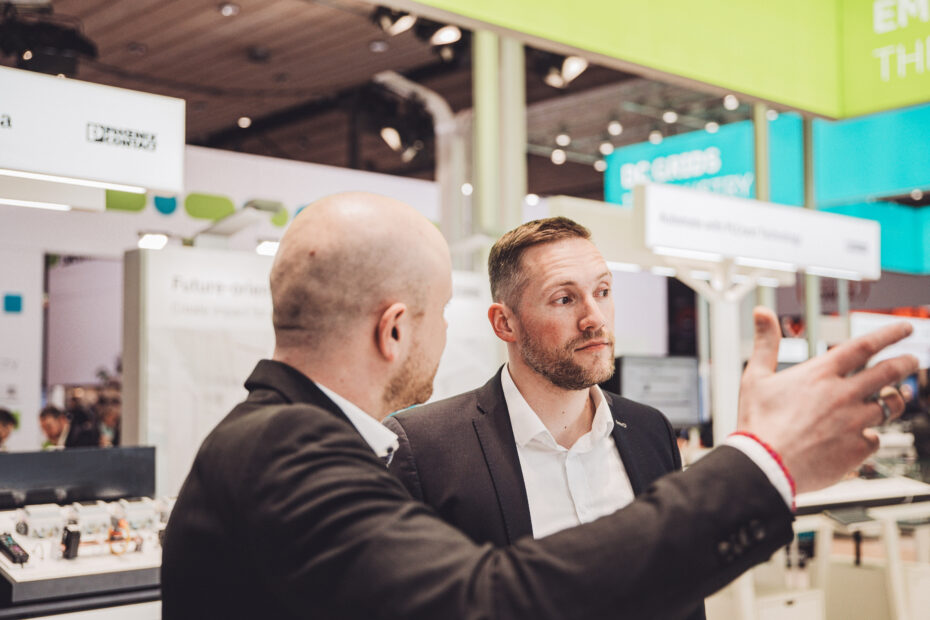
Try out solutions live, talk to our team. From live demos to real use cases, we focus on what matters to you. Visit us at the Phoenix Contact booth and experience the new machine-learning-based Forecast function in our Energy Management Service.