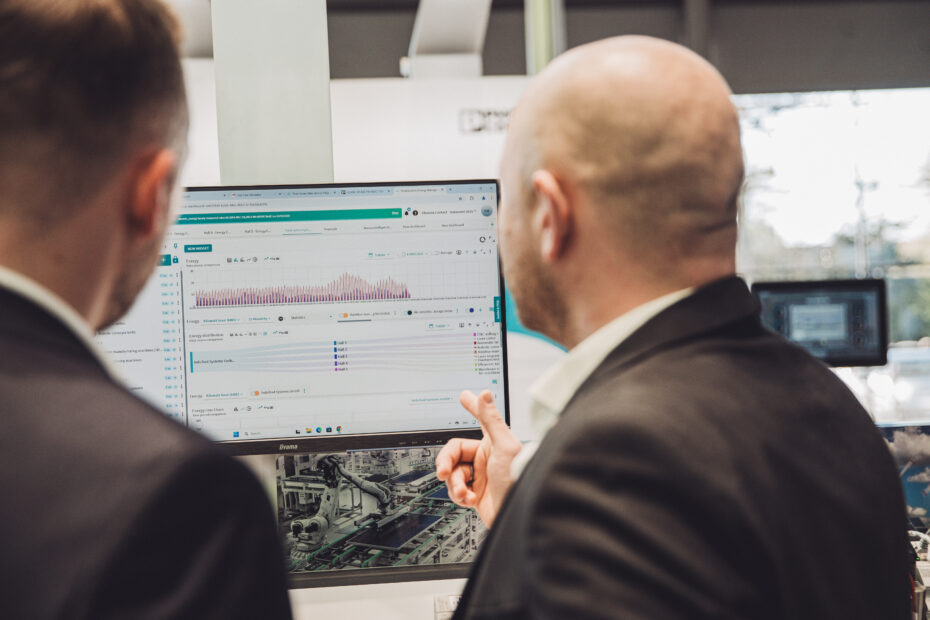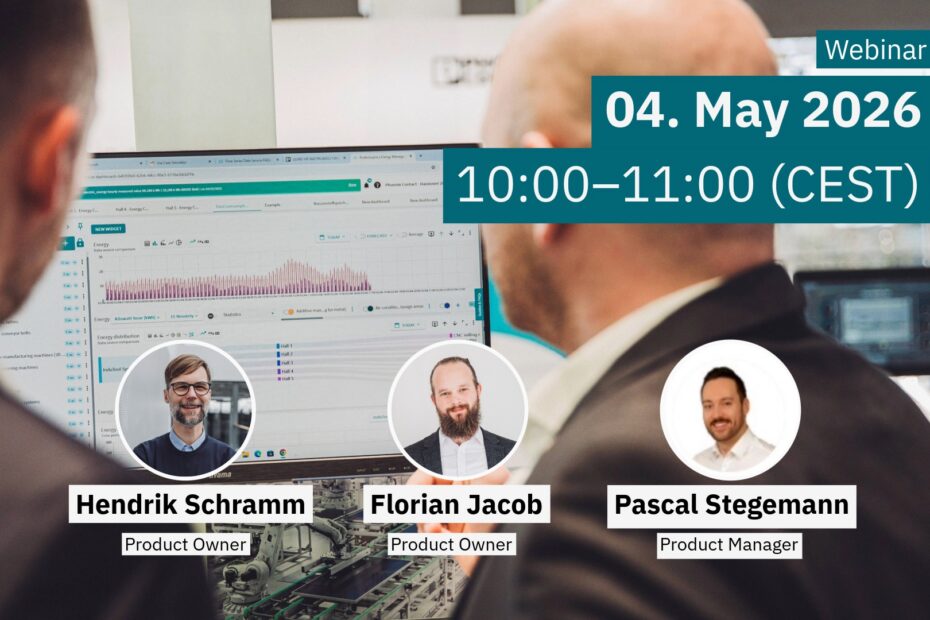
Free Webinar | Scalable Energy Management for Industry & Infrastructure
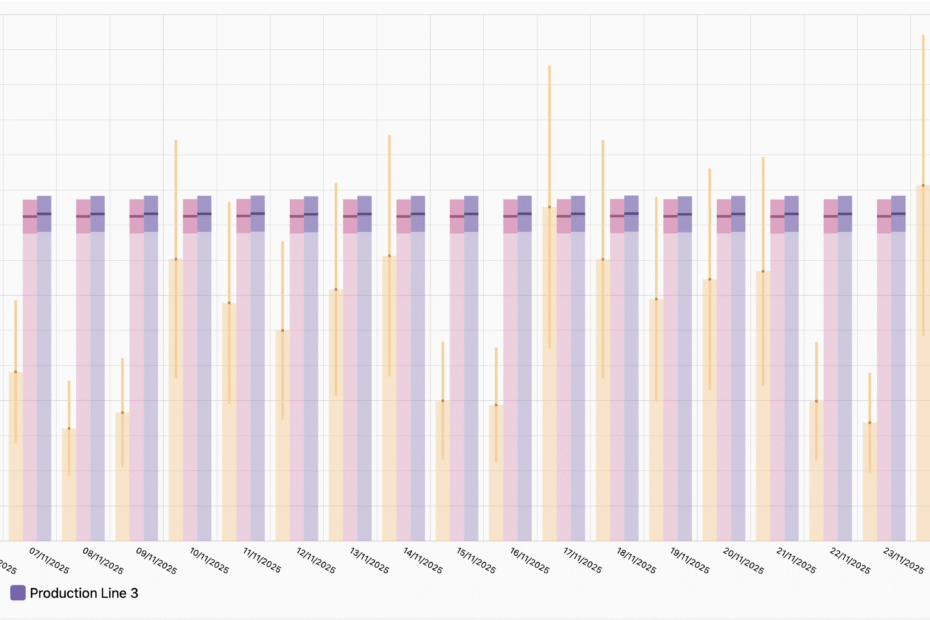
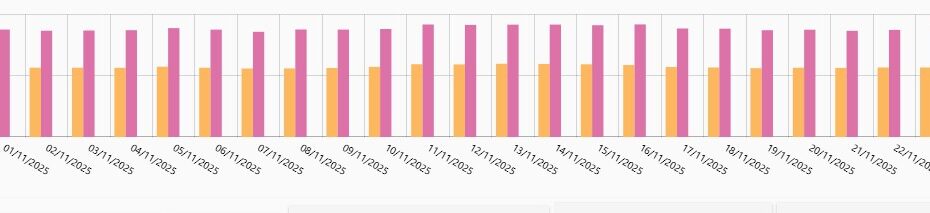
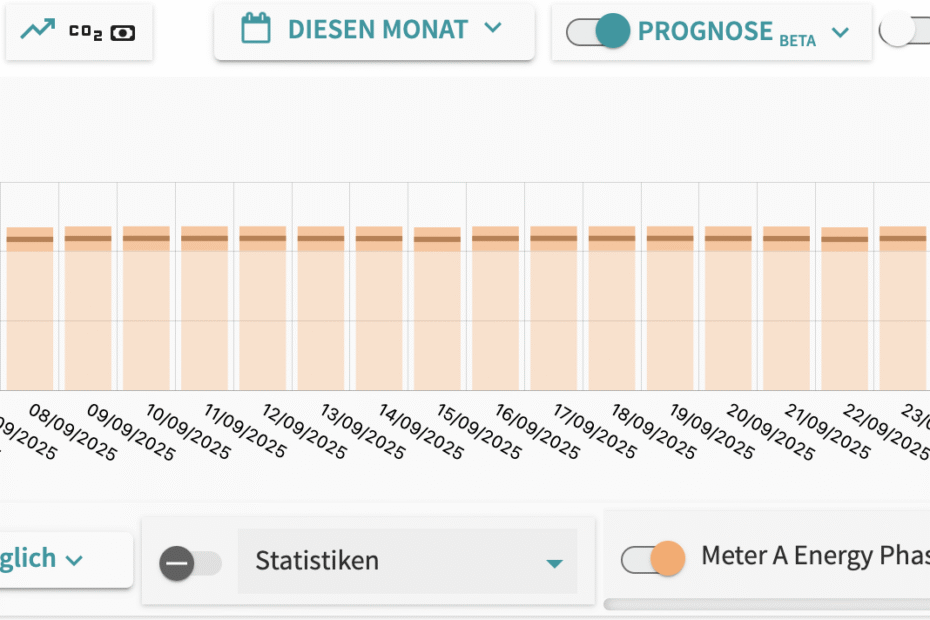
Webinar Language: German I Rising energy costs, expanding infrastructures and new requirements make transparent energy management essential. In our webinar, we show how to capture energy consumption holistically and analyze it intelligently.