Update: New functions in the EMMA Service at the beginning of the year
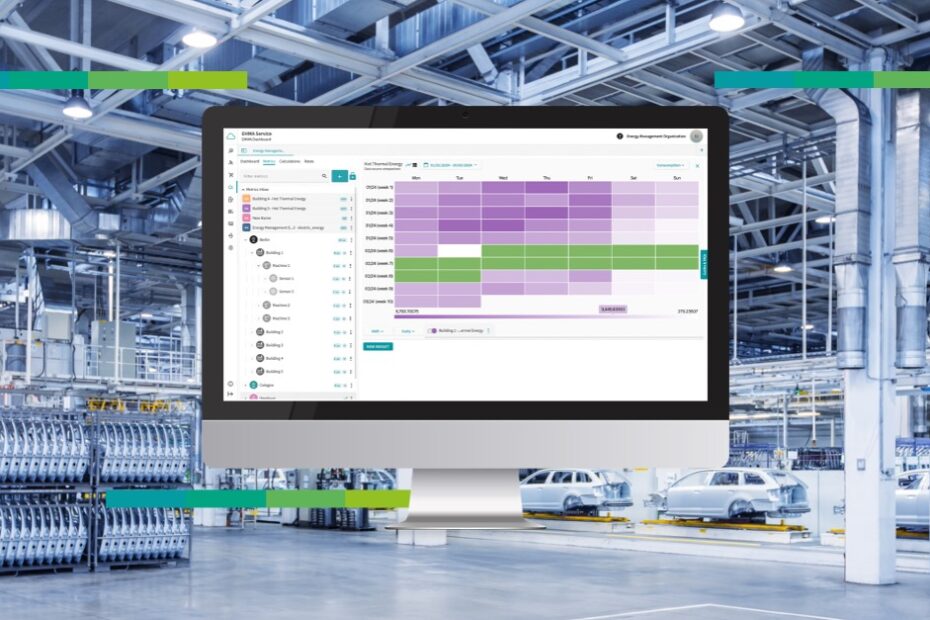
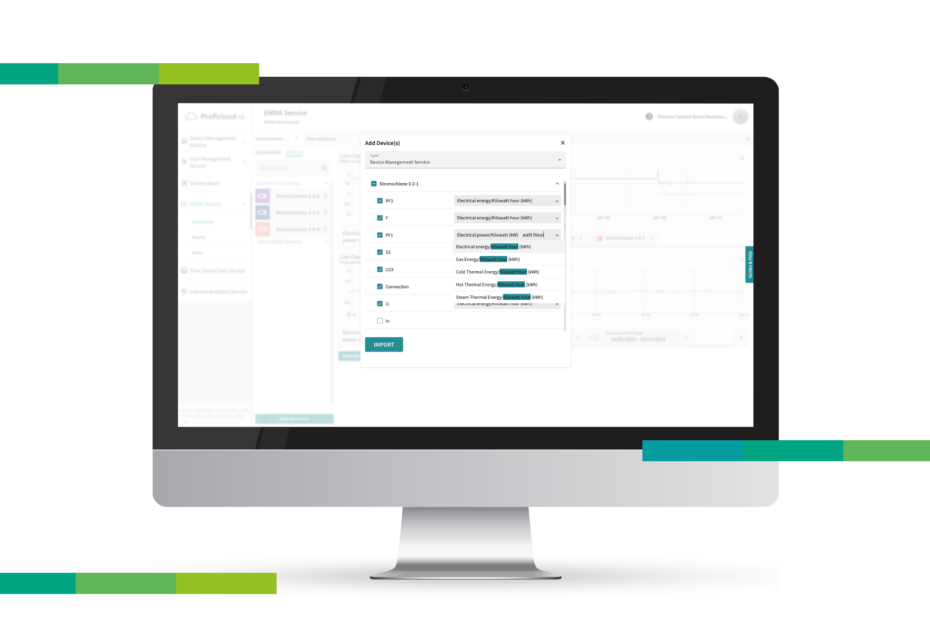
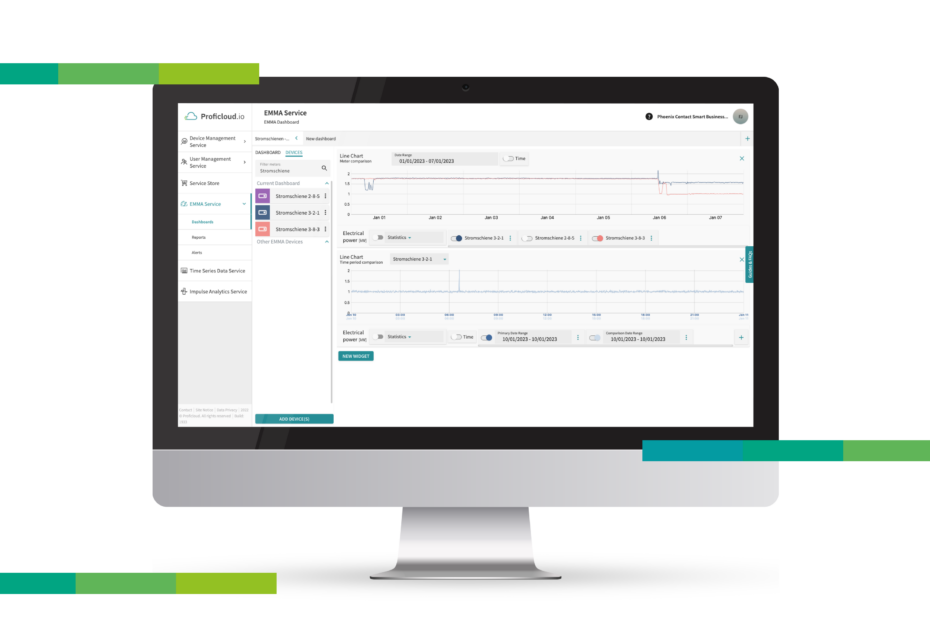
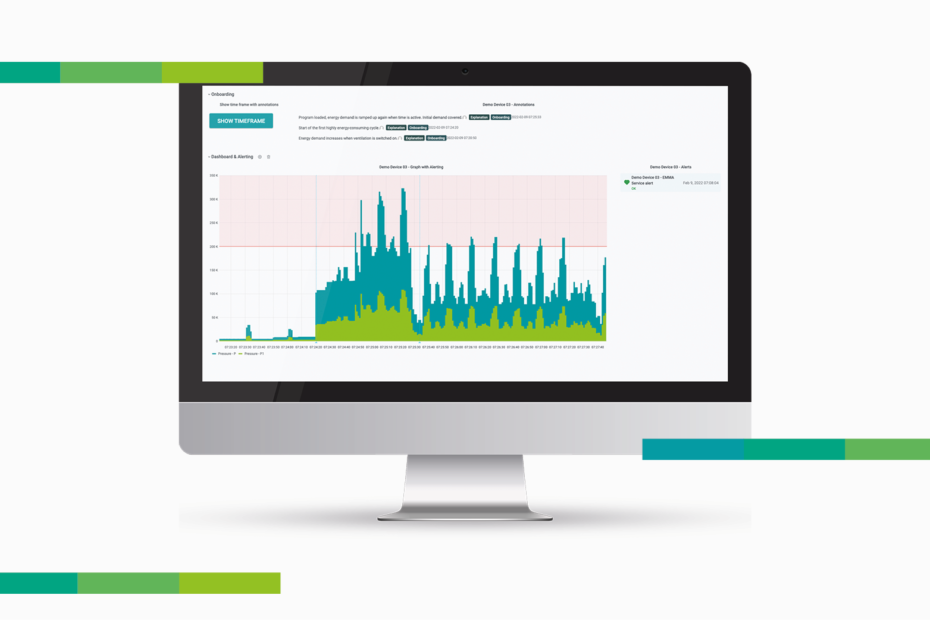
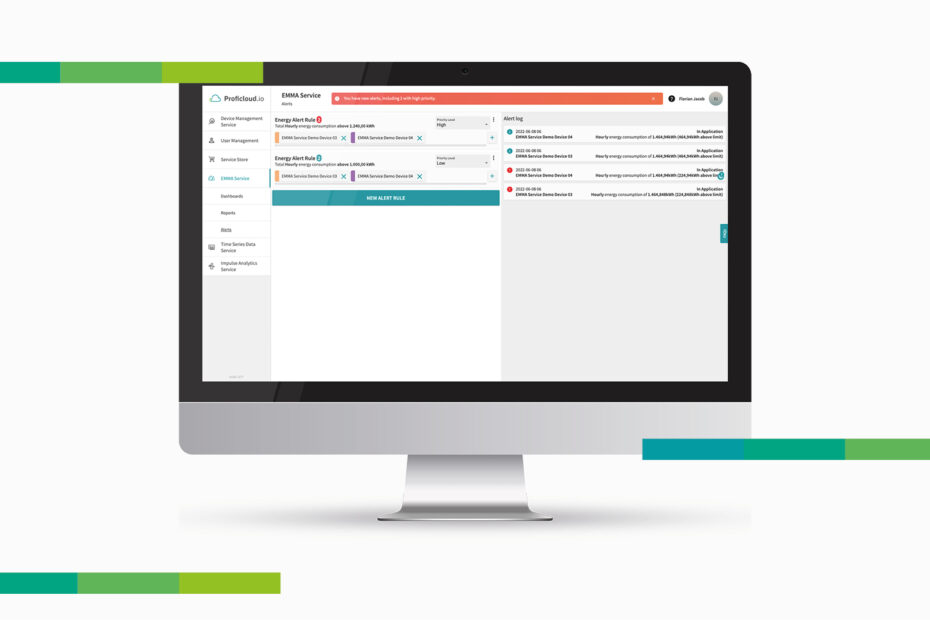
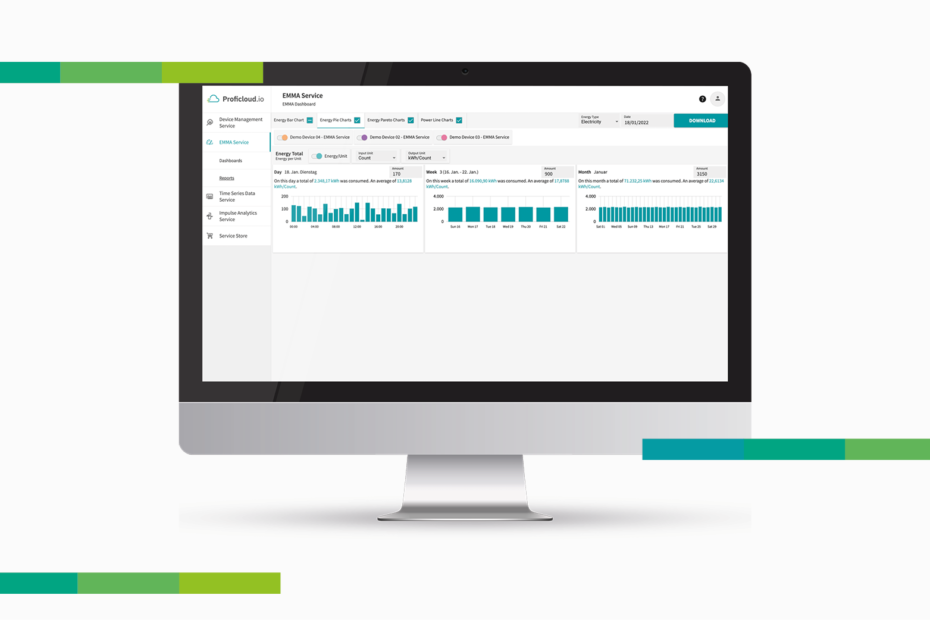
The EMMA Service has released several new features in its 1.11 update, including a table view function for easier data analysis, a heatmap for identifying consumption patterns and issues, and a new method for cost and CO2 analysis. Usability improvements include the ability to change widget titles and improved navigation. These updates optimize EMMA Service usage and increase resource monitoring and management efficiency.


