The Time Series Data Service is perfect for all those who rely on individuality and modifiability when visualizing data, because the Smart Service offers a variety of different (preset) visualizations.
A new visualization links the Time Series Data Service even more closely with the Device Management Service and enables an almost seamless interaction between the two Smart Services.
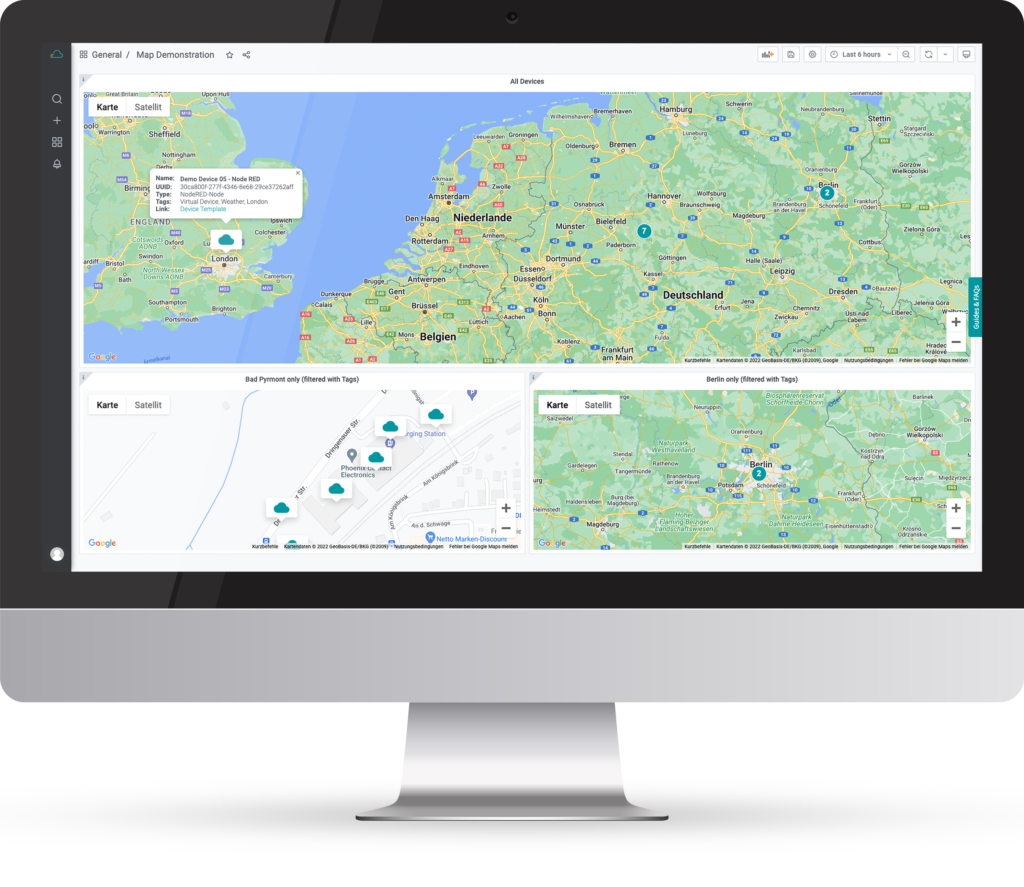
We are talking about a “DMS Map Plugin”. With this new plugin, all devices can be displayed in an interactive map in the Time Series Data Service. Static data such as UUID or device name is displayed, but also a link to the device templates is stored. For all users who want to get even more out of the plugin, individual links can also be stored for the devices – so you can link the monitoring dashboards of a production hall directly to the appropriate device on the map and can thus quickly and easily collect information about the monitored processes.
Hands on: Display devices, check status and use the device template
Hands on: Link individual dashboards to map marker
Hands on: Filter displayed device through tags
What is the Time Series Data Service?
The Times Series Data Service enables users to access, monitor, and track process data anytime and anywhere.
Easily configurable and web-based dashboards quickly and precisely visualize all relevant parameters requested by the user, such as the rotation speed of a wind turbine, engine temperatures, flow rates, or reject rates. They form the basis for data-driven decisions and big data applications. Thanks to Proficloud.io, you can use the Smart Service very easily and even with having no own or only limited IT resources!