TL;DR
New plugin in the Time Series Data Service with which annotations can be displayed in a list. This list can be filtered (like the list of alerts), so that e.g. only annotations with a certain day are displayed. Clicking on the entry sets the time frame to e.g. 10 minutes before and 10 minutes after the corresponding annotation.
Make knowledge accessible
The goal of simple visualizations is to make knowledge available and understandable for others. This is already very well possible with the different visualizations in the Time Series Data Service.
With the Time Series Data Service and Alerting feature, different people in an organization can already get or provide important insights into processes and threshold violations.
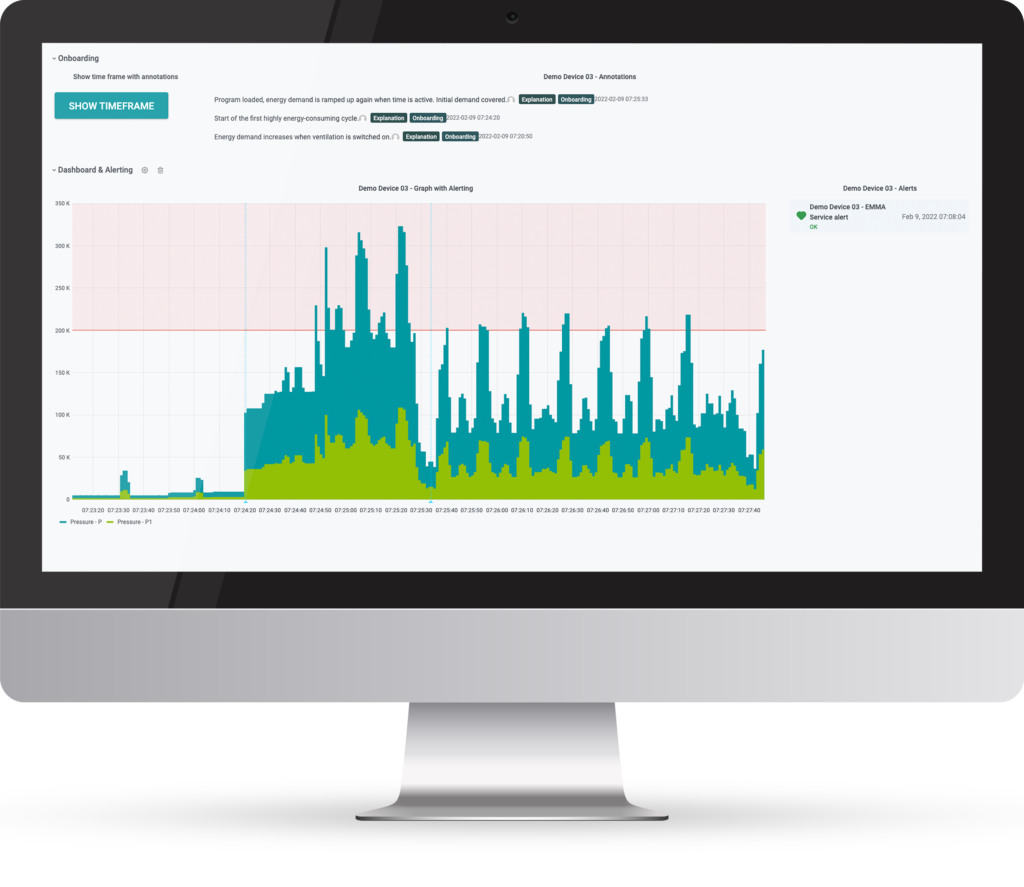
In the graph panel of a dashboard, it is also possible to see and better understand these limit violations. These can be further enriched with additional information, allowing for an even better understanding of boundary violations.
In addition to the annotations set by the alerting feature, it is also possible to set your own annotations and enrich them with information.
This helps, for example, in the moments when a manual restart of a machine is performed, which may not be picked up by the alerting.
Manual annotations in the Time Series Data Service
This feature is not necessarily new in the Time Series Data Service, but is now greatly improved, because the set markers can now be displayed in a panel in such a way that with one click a corresponding frame is called in the panel with the annotation.
In the new plugin for the Time Series Data Service, users, timestamps and tags are displayed in addition to the actual content of the annotation. If used thoughtfully, this provides a transparent and simple view into the system and, for example, the manual influences from the outside.
Hands on: Use the annotation list to create more transparency
What is the Time Series Data Service?
The Times Series Data Service enables users to access, monitor, and track process data anytime and anywhere.
Easily configurable and web-based dashboards quickly and precisely visualize all relevant parameters requested by the user, such as the rotation speed of a wind turbine, engine temperatures, flow rates, or reject rates. They form the basis for data-driven decisions and big data applications. Thanks to Proficloud.io, you can use the Smart Service very easily and even with having no own or only limited IT resources!