Weather adjustment in energy consumption: Simple implementation thanks to digital support
Intelligent energy management includes adjusting energy consumption and performance indicators for weather conditions to ensure accurate comparisons and evaluations.
Heating energy consumption in buildings is influenced annually by varying climatic conditions. How can energy managers account for the “weather” factor and ensure comparability of values over longer periods? The answer is weather adjustment – made especially easy with digital support.
Heating and cooling consumption are key factors in energy management. While collecting consumption data is straightforward, caution is needed when analyzing and drawing conclusions: daily weather has a significant impact. To compare consumption over time, across locations, or after energy retrofits, weather normalization is essential. The basis for this is heating and cooling degree days.

Heating Degree Days (HDD) quantify the theoretical heating demand of buildings and are derived from outdoor temperatures. These are compared to a threshold temperature. If the measured temperature falls below the threshold, the duration and magnitude of the deviation indicate how much heating is needed. The threshold varies by country and application; in Germany and the EU, a threshold of 15.5°C is commonly used.
Similarly, Cooling Degree Days (CDD) measure the cooling demand of buildings. This metric is mainly used in warmer climates but is gaining importance in cooler regions due to rising temperatures.
How the calculation works
Energy managers can obtain time series data for Heating and Cooling Degree Days (HDD and CDD) by downloading CSV files directly from the German Weather Service (DWD). While this is often the most convenient option, degree days can also be calculated independently using various methods, which differ in their level of detail and the mathematical effort involved.
The simplest method uses the daily average temperature. If this is above or below the threshold, the degree value for that day is calculated accordingly. A variation uses the average of the day’s high and low temperatures. This daily averaging reduces the impact of short-term threshold exceedances.

If energy consumption is highly sensitive to short-term temperature changes, the temporal resolution can be increased: instead of daily averages, hourly temperatures are used. These are compared to the threshold to calculate degree hours, which can then be converted into degree days.
With digital temperature recordings, energy managers can increase both the resolution of degree day values and the raw data. Each measurement point is normalized by the distance to the next point, effectively integrating the positive difference from the threshold.
Selecting the right energy performance indicators (EnPIs)
To evaluate energy efficiency, energy management uses Energy Performance Indicators (EnPIs) as key metrics. A valid analysis includes all variables influencing total energy consumption. For example, in a production line, energy consumption per unit produced is more meaningful than total consumption, as machine utilization significantly affects energy use.
When assessing and comparing heating energy consumption in similar buildings, optimizing energy-saving measures, or minimizing heating demand, energy managers must account for and isolate the weather variable.
Two example calculations
Example 1: Retrofit evaluation
A company retrofitted a building to improve heating efficiency. After one year, consumption increased from 100 MWh to 120 MWh. Without adjustment, the retrofit appears to have failed.
However, with weather normalization:
- Year before retrofit: 1,000 HDD
- Year after retrofit: 1,500 HDD
- EnPI = Consumption / HDD → 100 kWh/HDD vs. 80 kWh/HDD
The higher consumption was due to a colder winter. The retrofit actually improved efficiency.
Example 2: Site comparison
Two buildings, A and B, at different locations:
- A: 50 kWh/m²
- B: 60 kWh/m²
Initially, A seems more efficient. But:
- A: 1,000 HDD
- B: 1,200 HDD
- EnPI = Consumption / (Area × HDD) → 0.05 kWh/m²HDD for both
Thus, both buildings have similar heating efficiency.
Accurate energy analysis through weather adjustment
By incorporating heating and cooling degree days, energy consumption can be normalized for weather effects. Only then can energy efficiency monitoring and analysis yield valid results, enabling reliable evaluation of improvement measures.
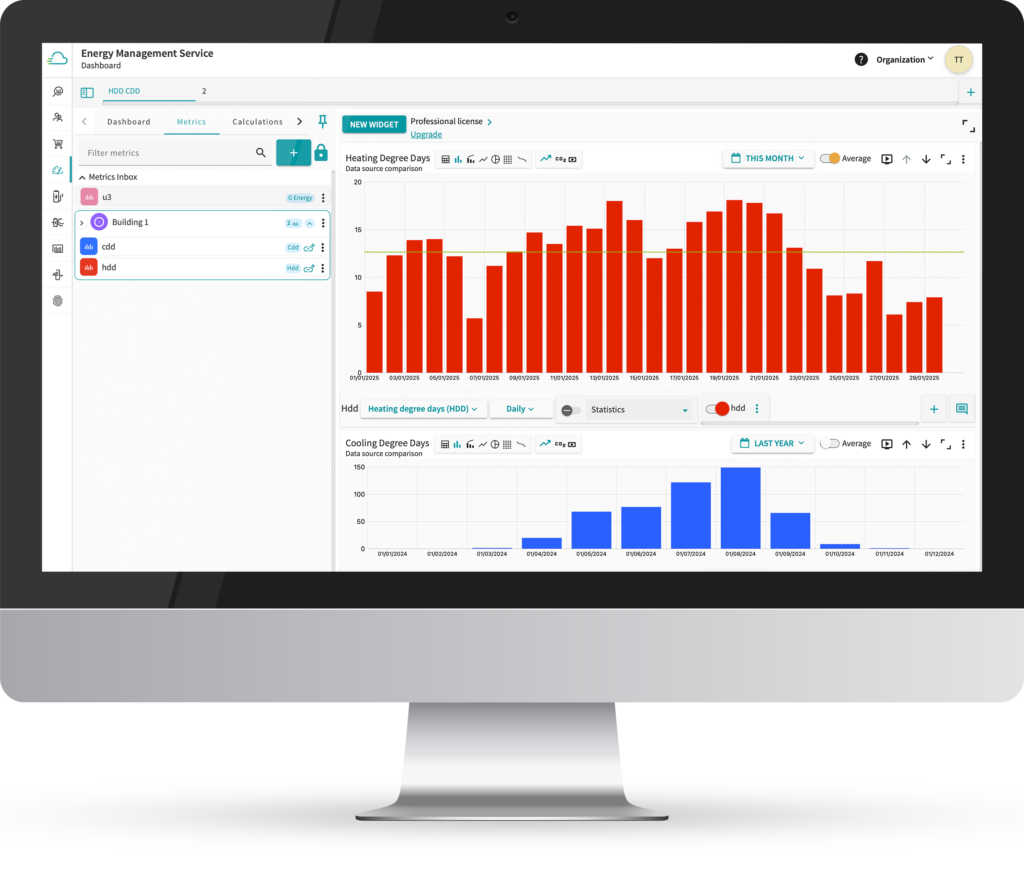
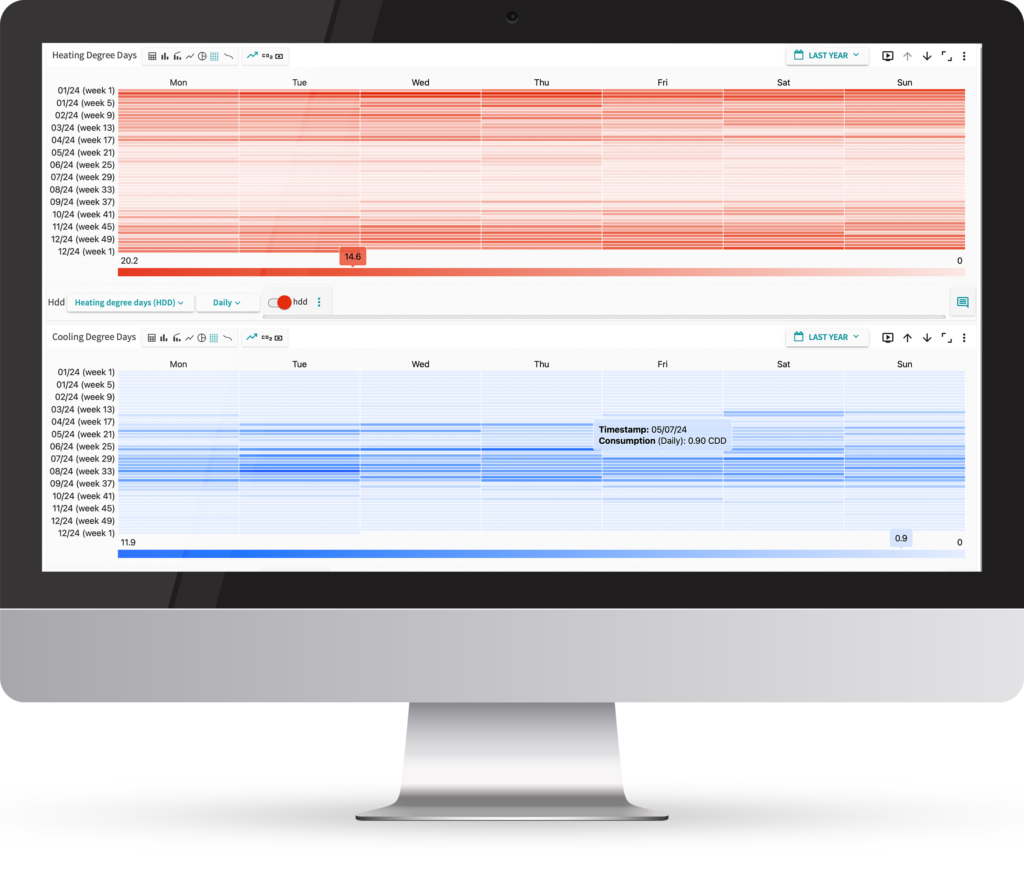
The Energy Management Service simplifies monitoring and supports informed decision-making. It is tailored to energy managers’ needs.
- Automated data transfer to Proficloud.io via IIoT-enabled hardware (e.g., Energy measuring devices (EMPro), PLCnext Technology (PLCnext Control), NodeRed)
- Optimized energy management aligned with ISO 50001
- Weather normalization feature; automatic weather data import planned
- High usability, intuitive navigation
- Visualization tools and user-friendly dashboards
- Efficient workflows and remote monitoring of energy and performance data
Incorporating heating and cooling degree days into energy analysis enables a normalized, climate-adjusted evaluation of consumption data—providing a foundation for benchmarking, performance tracking and strategic energy optimization.