New Status Monitoring in the TSD Dashboard Library available
Discover how you can monitor up to 32 status values per metric directly in the Time Series Data Service. With preconfigured TSD Library dashboards, you gain transparent insights into availability, processes, and system health—without additional setup.
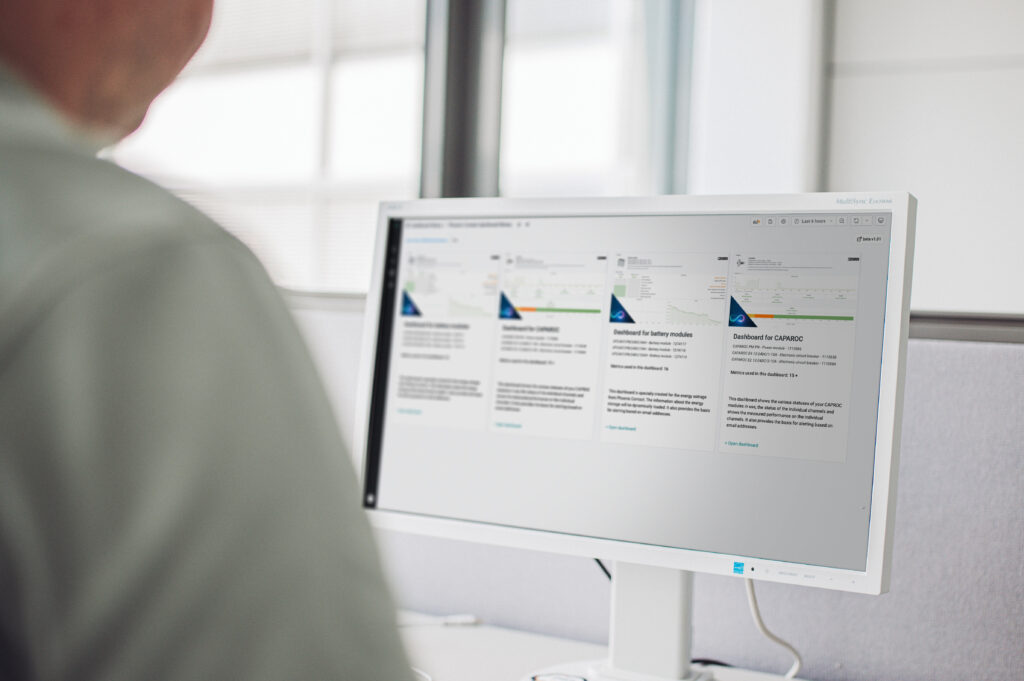
The TSD Dashboard Library is a set of preconfigured dashboards within the Time Series Data Service on Proficloud.io. It provides ready-to-use visualizations for common use cases, so there is no need to create dashboards from scratch.
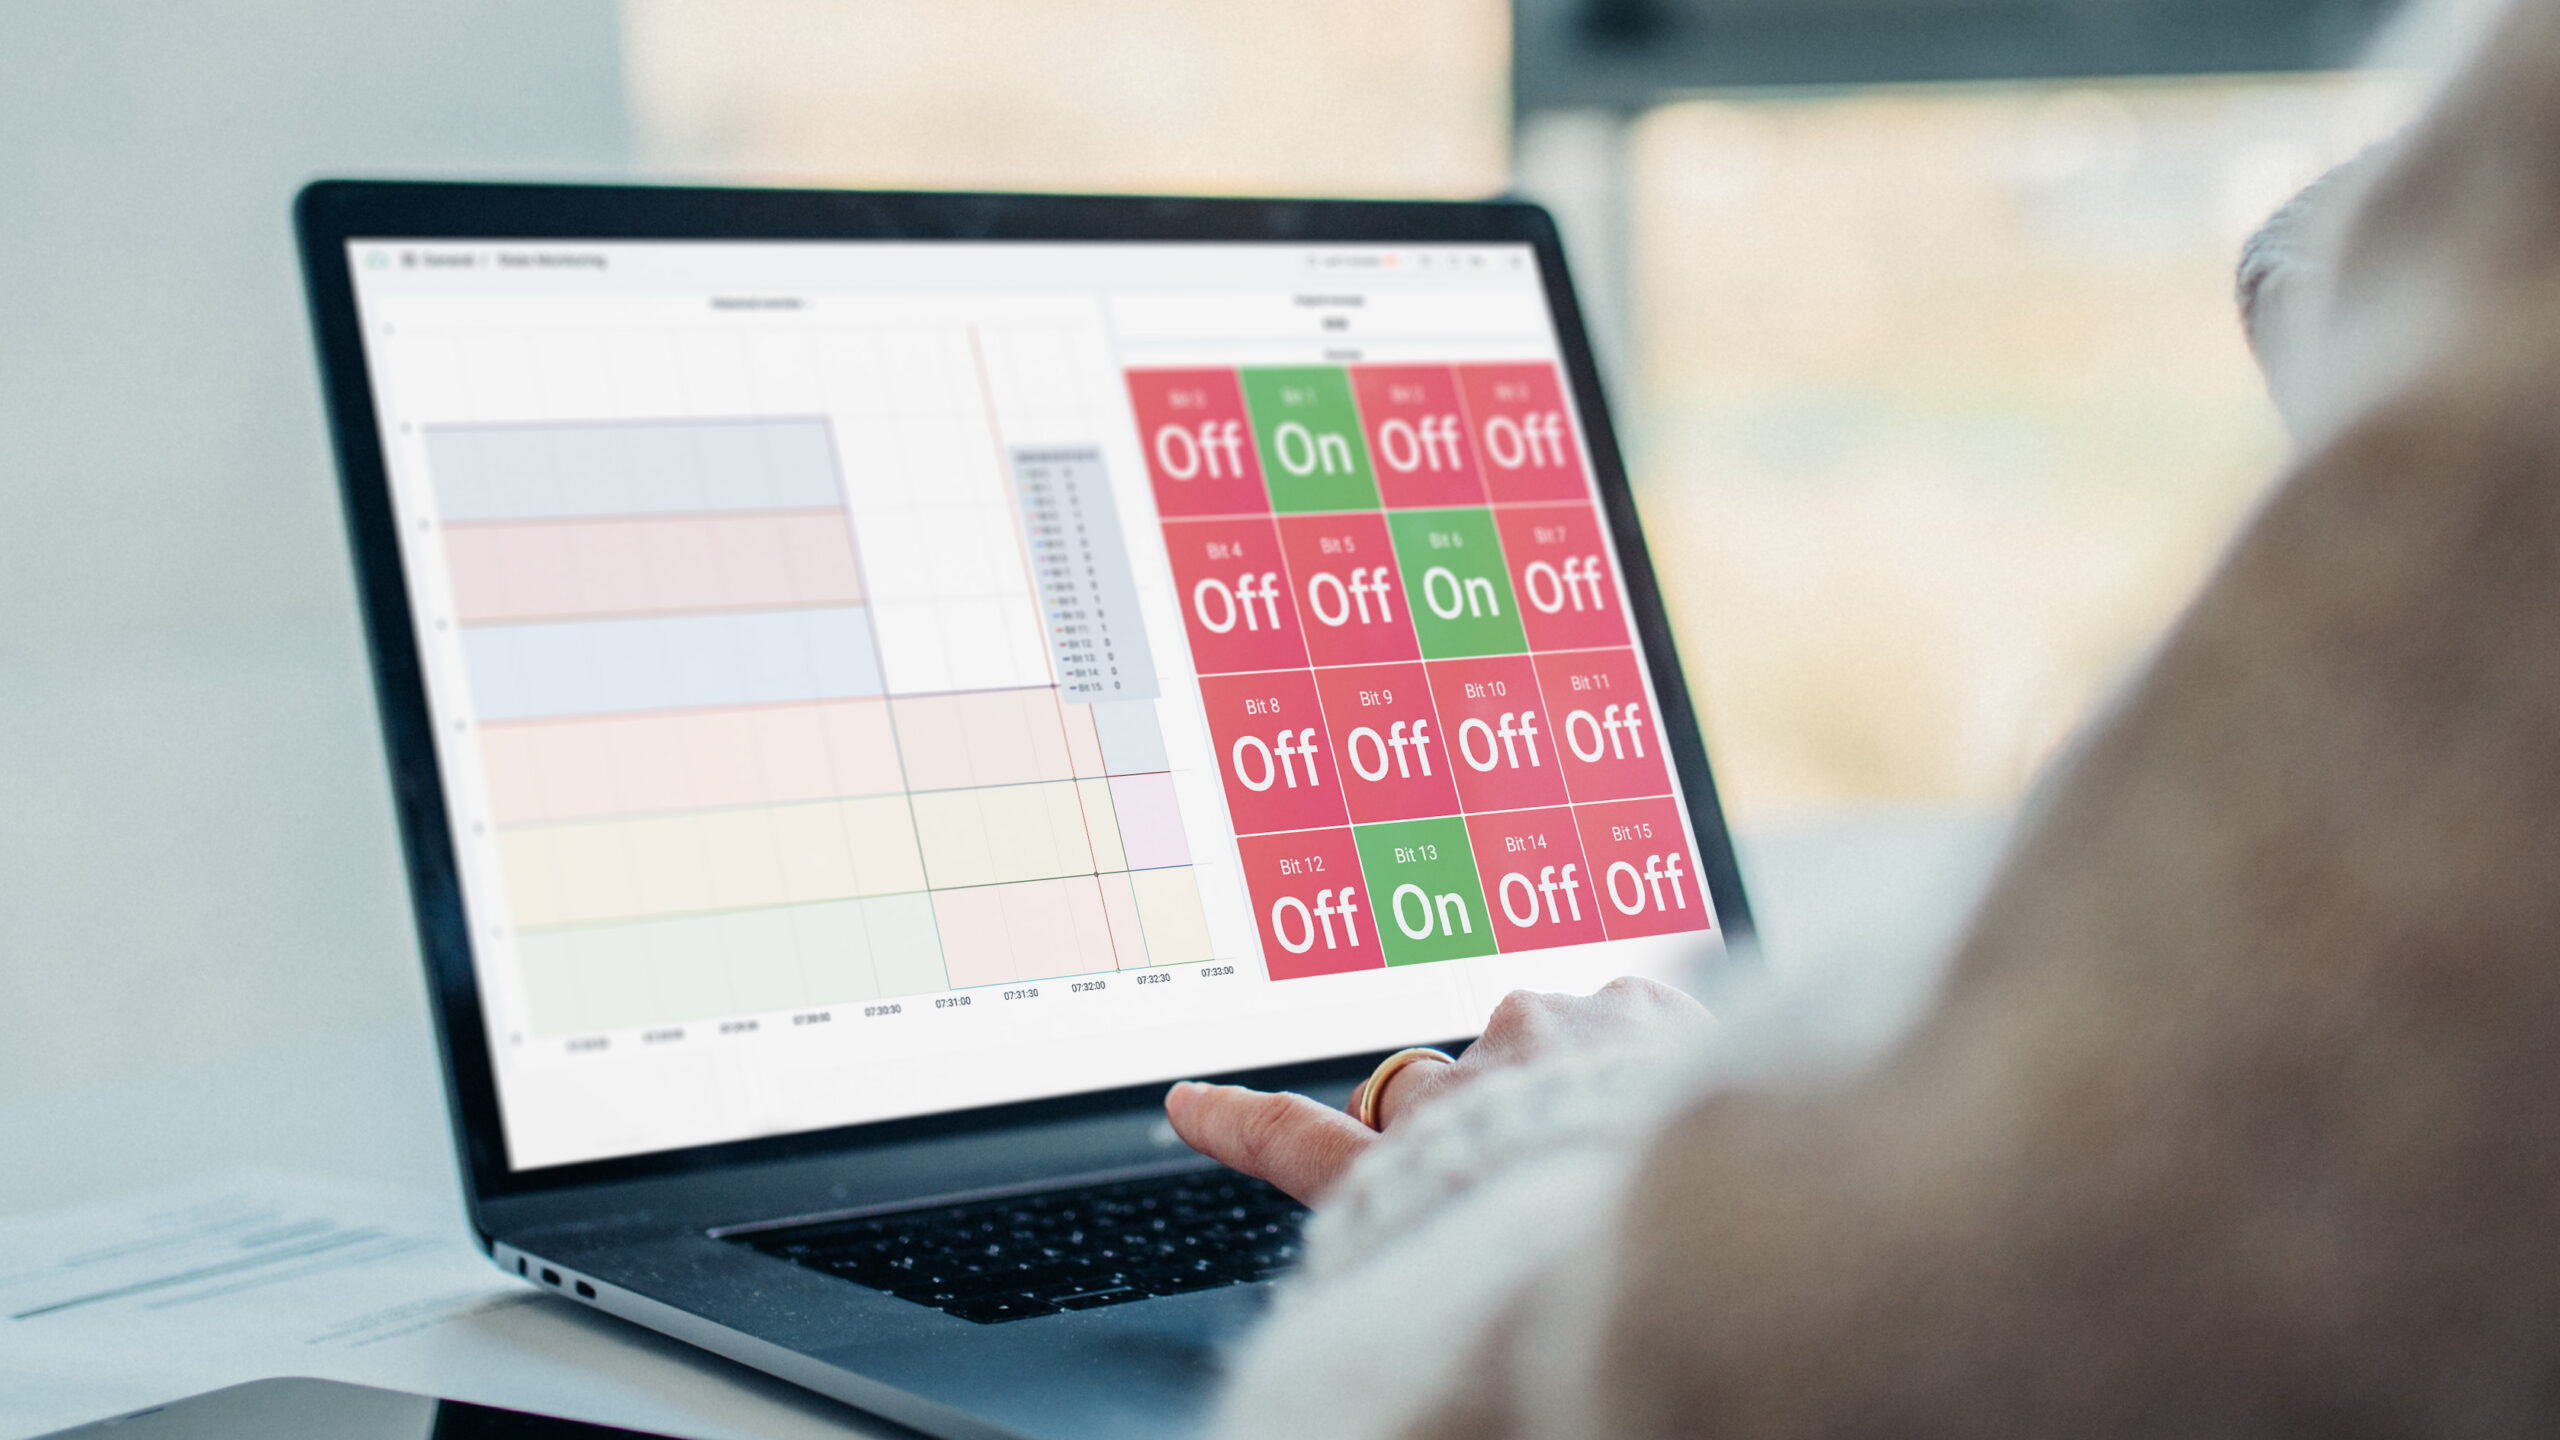
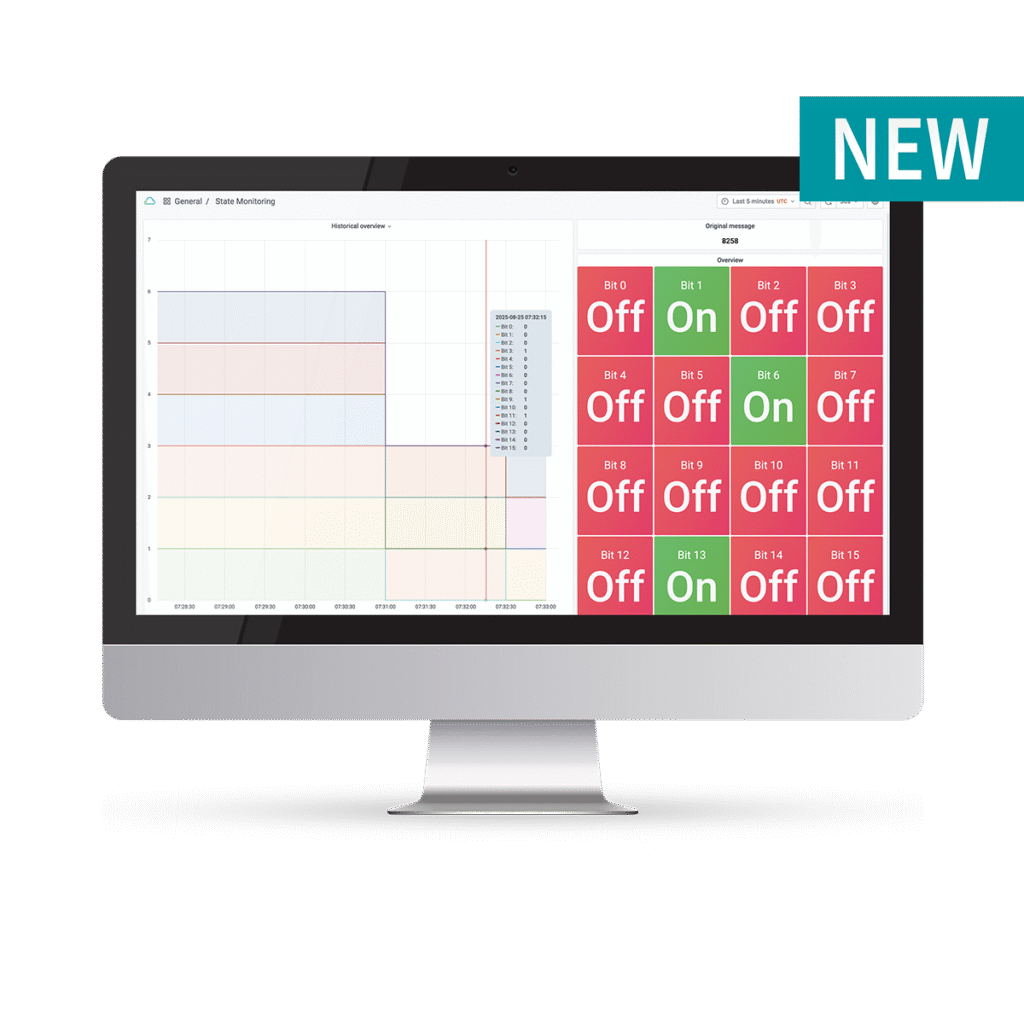
With the new dashboard, users can carry out status monitoring directly – with up to 32 different status values per metric. The metric sends the value of a DoubleWord, which is then split into individual bits in the Time Series Data Service. This enables straightforward monitoring and can later be extended with custom notifications.
Status monitoring at a glance
The dashboard makes it possible to monitor typical conditions such as:
- On / off
- Fault / no fault
- Okay / not okay
Such checks are part of almost every industrial application.
Typical applications
The dashboard is suitable for a range of scenarios, for example:
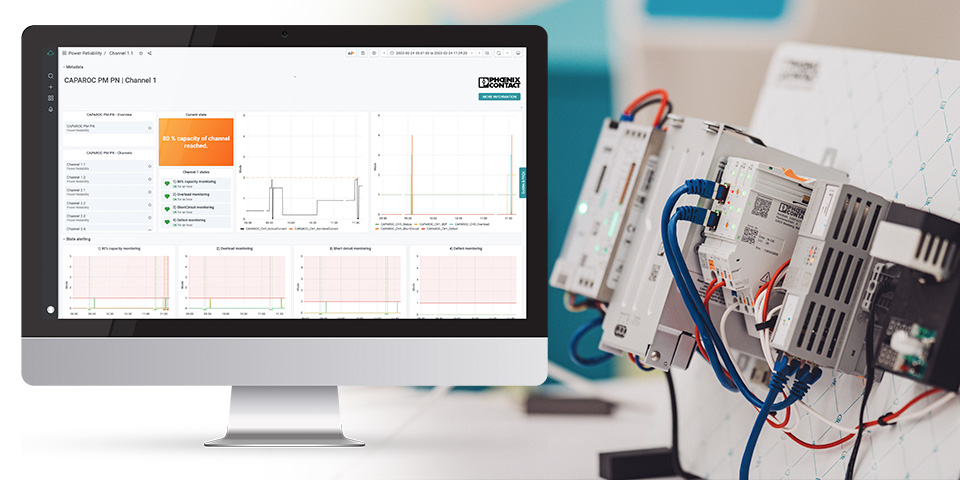
- System availability: e.g. checking whether a fuse in a CAPAROC module is operating at 80% capacity
- Thermal processes: such as verifying whether a burner is active
- Controller heartbeat: confirming whether a controller is connected
This extension makes it easier to keep track of critical conditions without additional setup effort.
Best practice: from monitoring to alerts
A practical approach is to begin with a single DoubleWord metric and focus on a limited number of status bits that are essential, such as connectivity, thermal alarms or availability. Mapping these bits directly in the Time Series Data Service provides:
- Immediate transparency without the need for custom dashboards
- Clear insight into which conditions occur most frequently
- The option to add targeted notifications for the most relevant bits
This staged method demonstrates the benefits of IIoT monitoring early on while keeping project complexity and costs manageable.
Further information

Hi, my name is Florian Jacob and I am glad to help you out!
Please do not hesitate to contact me. Also, if you have any suggestions or comments, just send us a message to inbox[at]phoenixcontact-sb.io and we will answer as soon as possible.