Practical Tools for Energy Managers: Forecasting, Cost Models, and Visualization
Discover how the new Energy Management Service helps you plan ahead with forecasts, adapt to dynamic tariffs, and visualize key KPIs. Gain practical insights to manage energy costs efficiently and support well-founded decisions in your IIoT projects.
The Energy Management Service from Phoenix Contact provides a cloud-based solution that helps companies record, analyze, and optimize their energy consumption. The latest version introduces several new functions that allow users to interpret their data more effectively and improve decision-making processes. Alongside new visualization options, consumption forecasts and dynamic cost calculations are now available. This makes the service an even more flexible tool for energy managers who want to control their operations based on reliable data.
New Features at a Glance
Consumption Forecast (Beta)
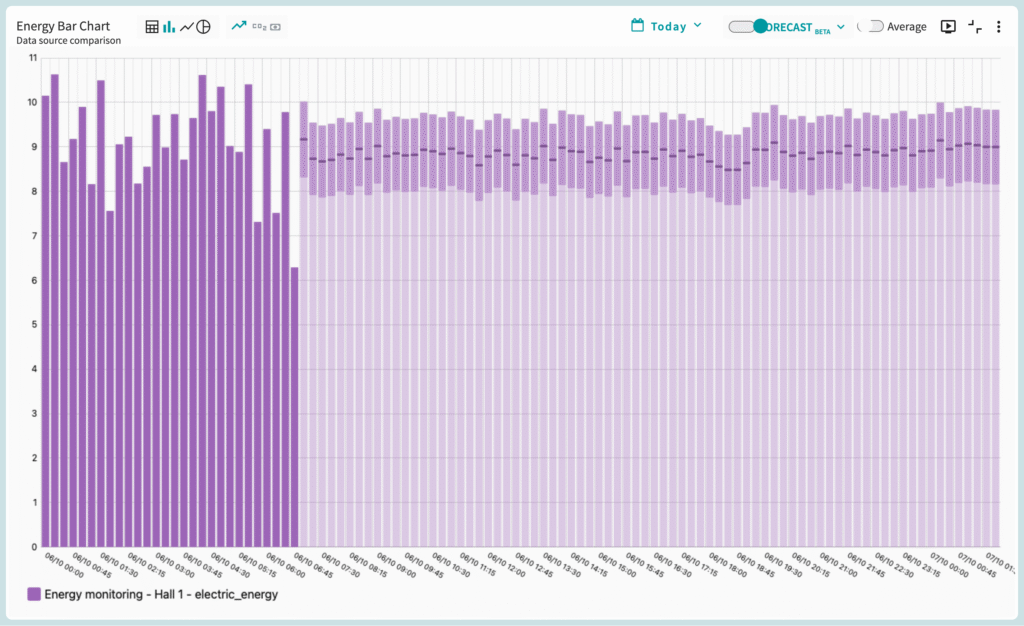
One of the central new features is the ability to calculate consumption forecasts based on historical data. Once the forecast is activated, a machine learning process runs in the background. Users can also select the desired confidence interval to tailor the calculation to their specific needs. At present, this function is available as a beta version.
Tariff-Based Dynamic Cost Calculation
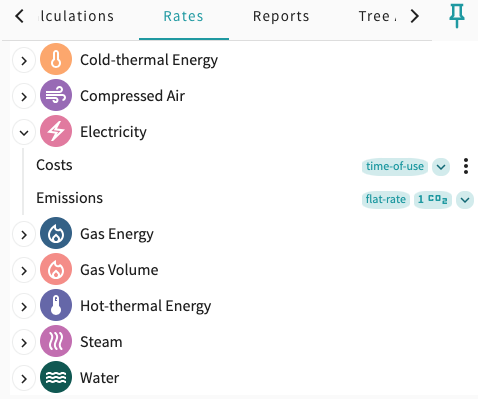
One of the central new features is the ability to calculate consumption forecasts based on historical data. Once the forecast is activated, a machine learning process runs in the background. Users can also select the desired confidence interval to tailor the calculation to their specific needs. At present, this function is available as a beta version.
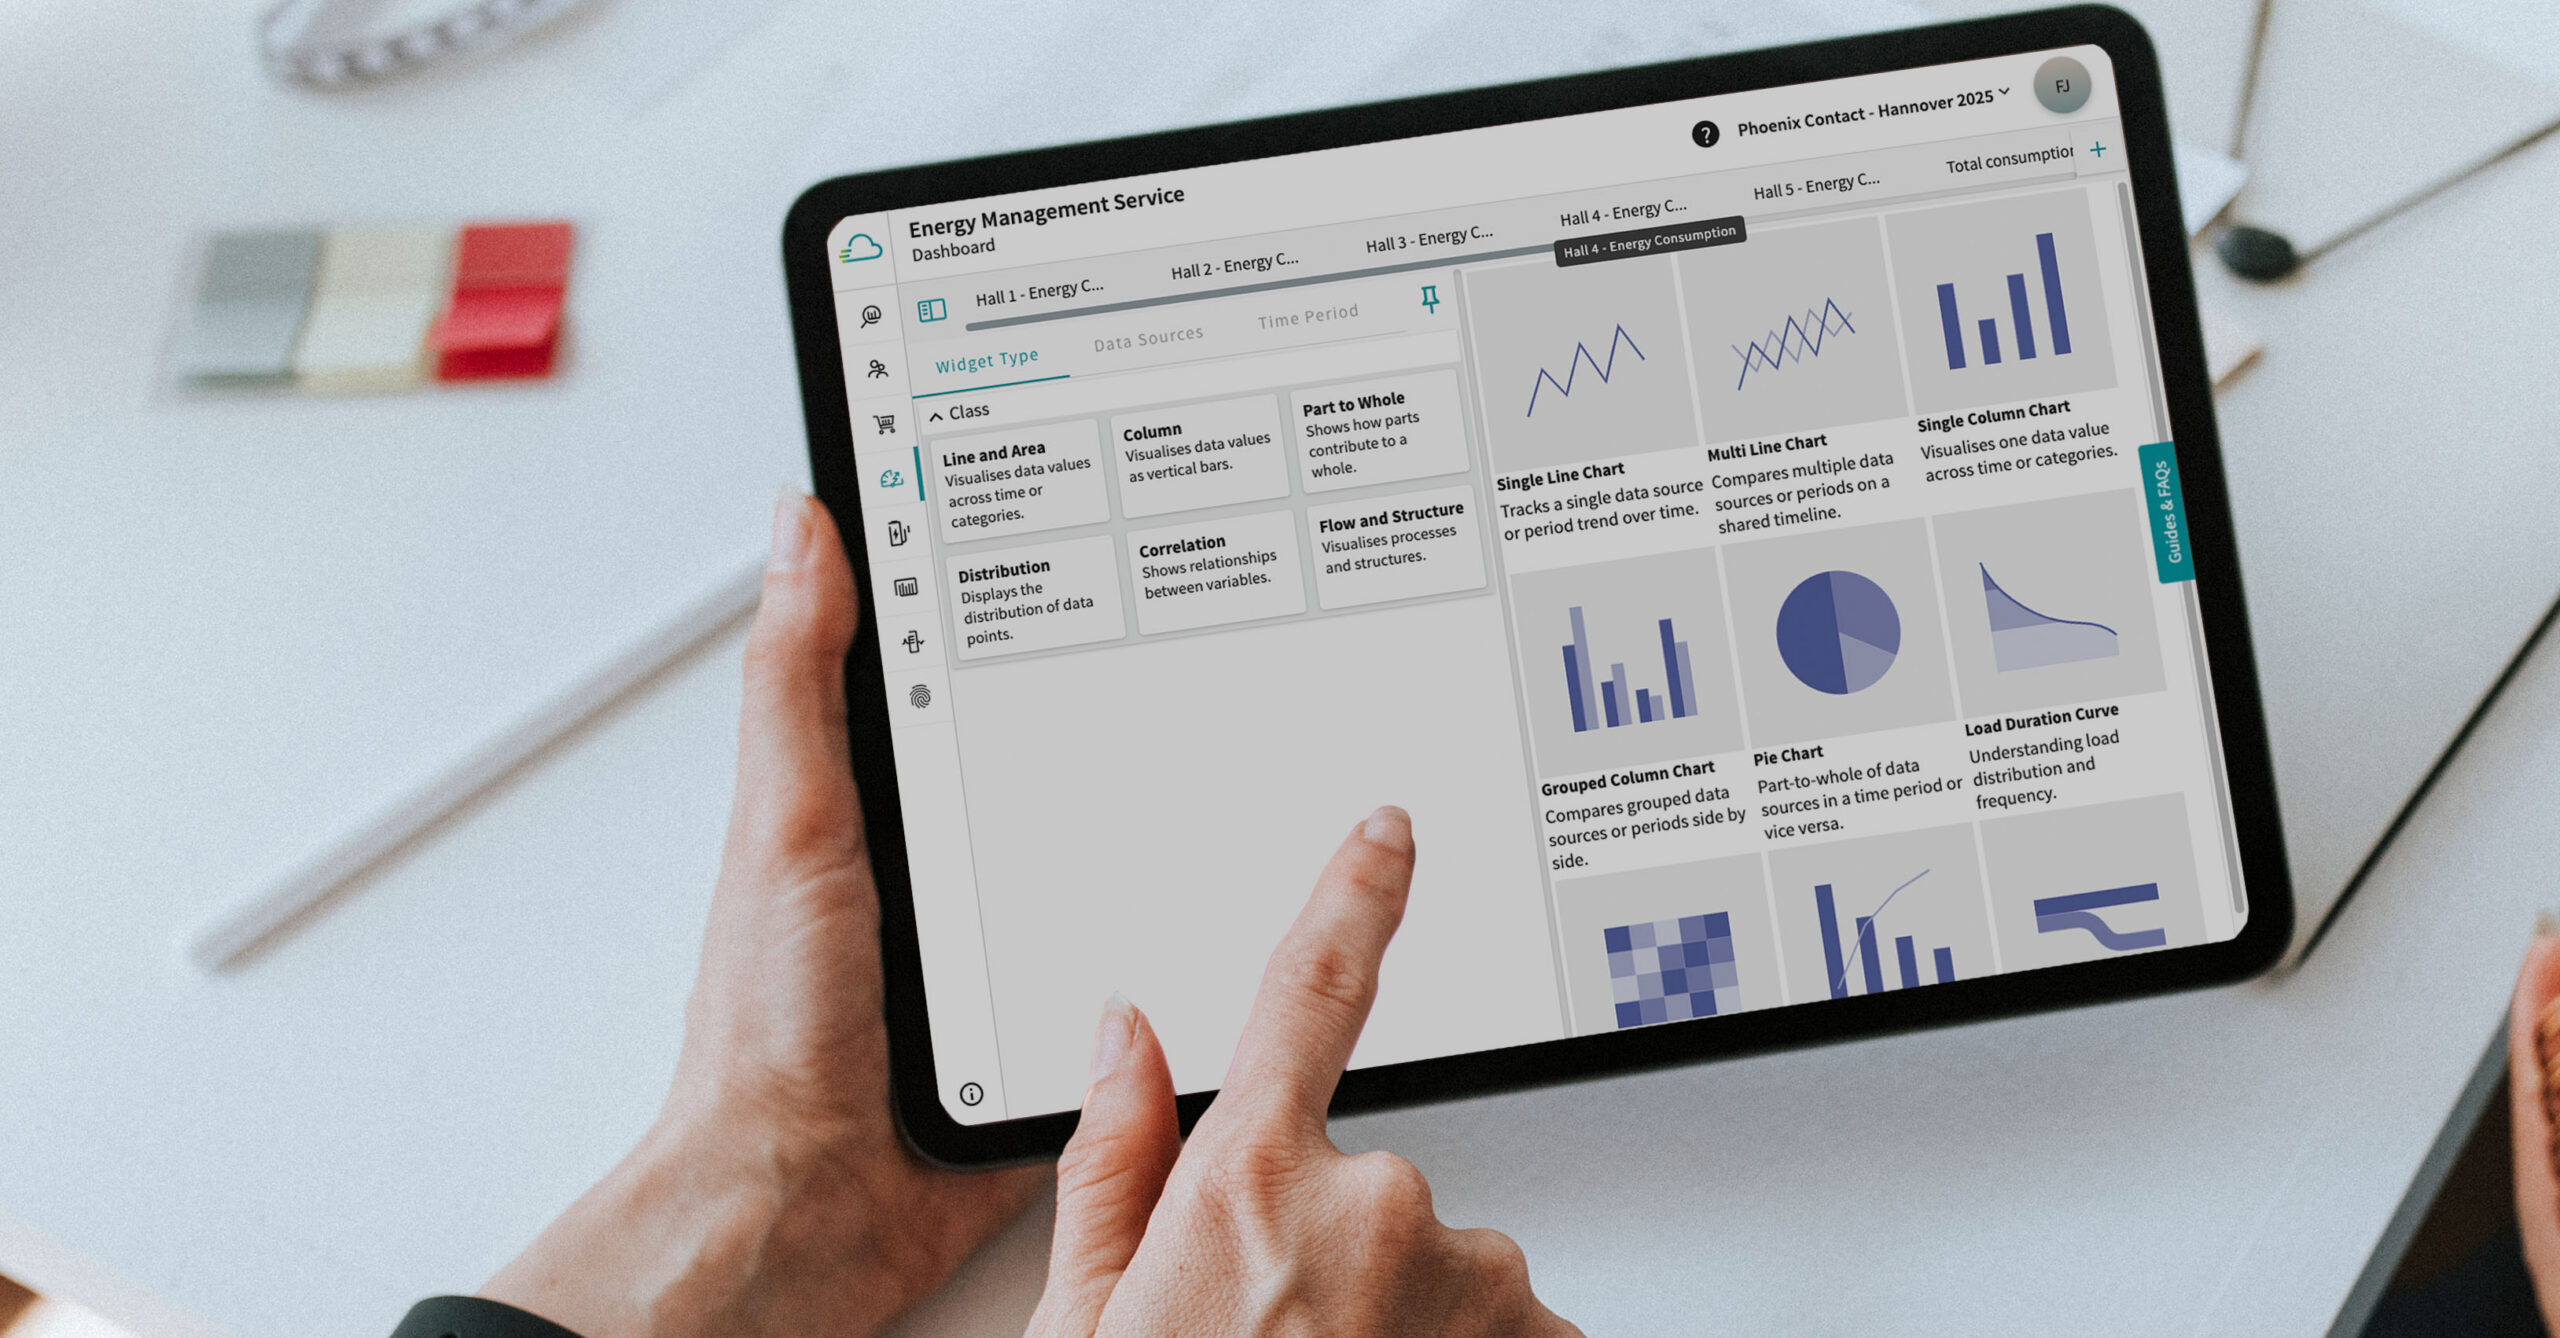
New Widget Creation Workflow
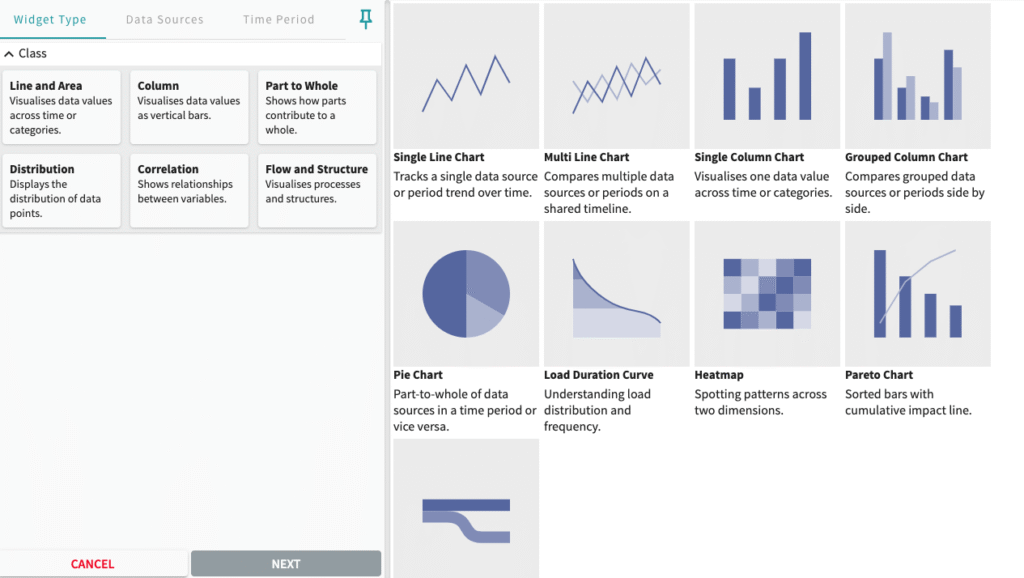
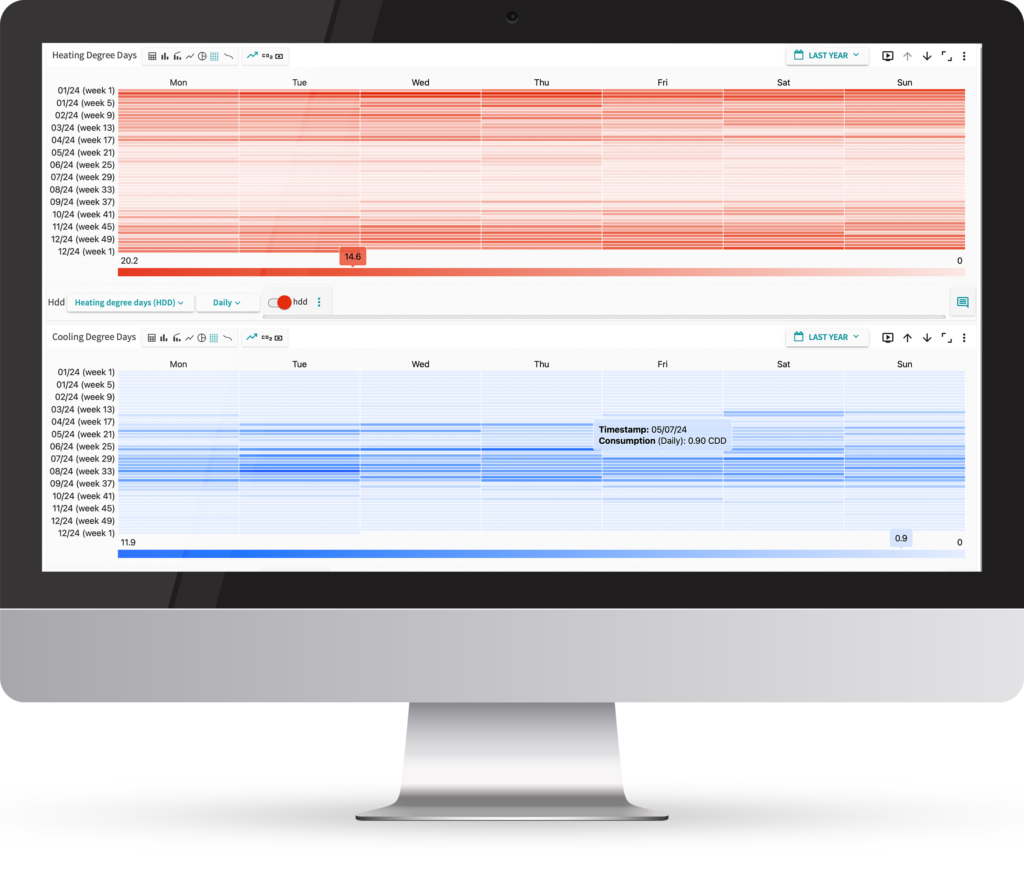
The process of creating widgets has been redesigned. Users now start by choosing from a preview of various chart types—such as line, bar, or Sankey diagrams. This makes it easier to find the right visualization without going through multiple trial-and-error steps.
Practical Use and Best-Practice Examples
- Forecasts for Budget Planning: Forecasting energy consumption over the coming days provides a clearer basis for planning. For example, it becomes visible how additional production shifts affect overall consumption and the resulting costs.
- Dynamic Cost Calculation with Flexible Tariffs: Many companies now work with electricity tariffs that change hourly. By integrating pricing data into the Energy Management Service, users can monitor not only their consumption but also their actual costs in real time. This makes it easier to identify when energy-intensive processes should be shifted to cheaper tariff periods.
- Comparisons Across Production Areas: With the new widget options, consumption data from different halls or machines can be displayed side by side. This makes it immediately clear which areas have consistently higher peaks and where potential savings can be achieved.
- Targeted Aggregation for Relevant KPIs: Management typically requires clear, aggregated KPIs, such as total weekly costs or average consumption per shift. With the new aggregation options, exactly those values can be selected and displayed.
- Faster Onboarding of New Employees: Thanks to additional tooltips, new colleagues can be introduced to the system more easily. The explanations built directly into the interface reduce training efforts and minimize the risk of operating errors.
Benefits for Users
The combination of forecasting, flexible cost calculation, and improved visualization enables more informed decisions. For companies just starting with energy management projects, the modular approach is particularly valuable: they can begin with simple KPIs and gradually increase complexity as needed.
Key advantages include:
- Efficiency gains through improved planning of consumption and costs.
- Simplified reporting with flexible visualization and aggregation.
- Future readiness thanks to integrated forecasting and dynamic pricing features.
- Lower training effort due to clearer user guidance.
This allows companies to go beyond retrospective data analysis and actively shape their energy usage based on forecasts and real-time information.
Conclusion
With its latest functions, the Energy Management Service has evolved into a practical tool for data-driven energy management. Forecasts, flexible cost models, and improved visualizations provide new opportunities to better understand and control energy consumption. For medium-sized companies in particular, this creates added value by increasing efficiency internally and supporting well-founded arguments at the management level.
Explore Live Insights
Experience smart energy management – try it free for 30 days
Explore the functionality of our Energy Management Service. See how simple it is to work with energy data and uncover opportunities that drive real operational impact.

Schedule live demo
Would you like to see the functions live? We will be happy to show you all the functions directly in live operation, make an appointment today!