Energy Management Service
Monitor, analyze and manage your energy usage across industries with a manufacturing-independent cloud solution for energy management.
- Comprehensive feature set: Data comparison, dynamic time periods, cost and CO2 conversion and remote access.
- Flexibility and adaptability: Manufacturer-independent, cross-industry and scalable.
- User-friendliness and customization: Customizable dashboards, individual alerting and custom EnPI reports.
- Compliance and eligibility for funding: Assistant for DIN EN ISO 50001:2018 and BAFA-compliant software.
Contact us so we can work together to meet your requirements and needs.
Energy Management Service: Your path to efficient energy management
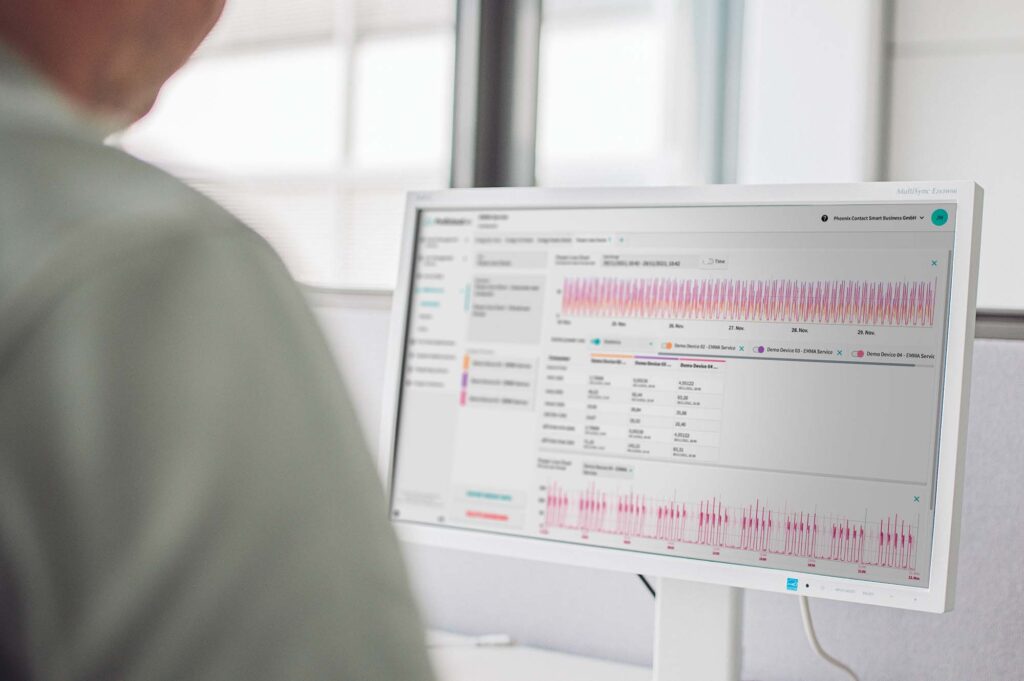
The Energy Management Service offers a comprehensive solution for monitoring, analyzing and managing your energy consumption anytime and anywhere. Designed to meet the needs of energy managers, this Smart Service enables detailed near real-time monitoring and analysis of energy data. By identifying trends and patterns, informed decisions can be made to optimize energy efficiency and reduce operational costs. With user-friendly dashboards and an integrated alert system, the Energy Management Service offers an intuitive and effective way to capture your energy consumption and achieve your sustainability goals.
Why the Energy Management Service?
Our solution combines intuitive usability with measurable impact. It enables a fast start and delivers lasting results.
Monitoring and analyzing data
Near real-time monitoring and informed decision-making through data analysis.
Cross-industry solution
Usable in various industries, versatile and adaptable, with customizable dashboards.
Manufacturer-independent integration
Flexibility in the choice of devices and systems, no binding to a specific manufacturer. Easy integration into existing systems.
Supports all energy types
Comprehensive monitoring and analyzation of all resources (electricity, water, air, gas and steam) and holistic energy management.
Easily customizable dashboards
User-friendly, tailored views for different users, thanks to drag-and-drop functionality and customizable widgets.
Remote Access
Access from anywhere, increased flexibility and mobility through cloud-based solutions and remote access options.
Scalability
Unlimited growth and adaptation to company and project size through modular structure and easy expandability.
Key Features
The Energy Management Service offers a wide range of powerful features for monitoring, analysis and efficient management of energy consumption data.

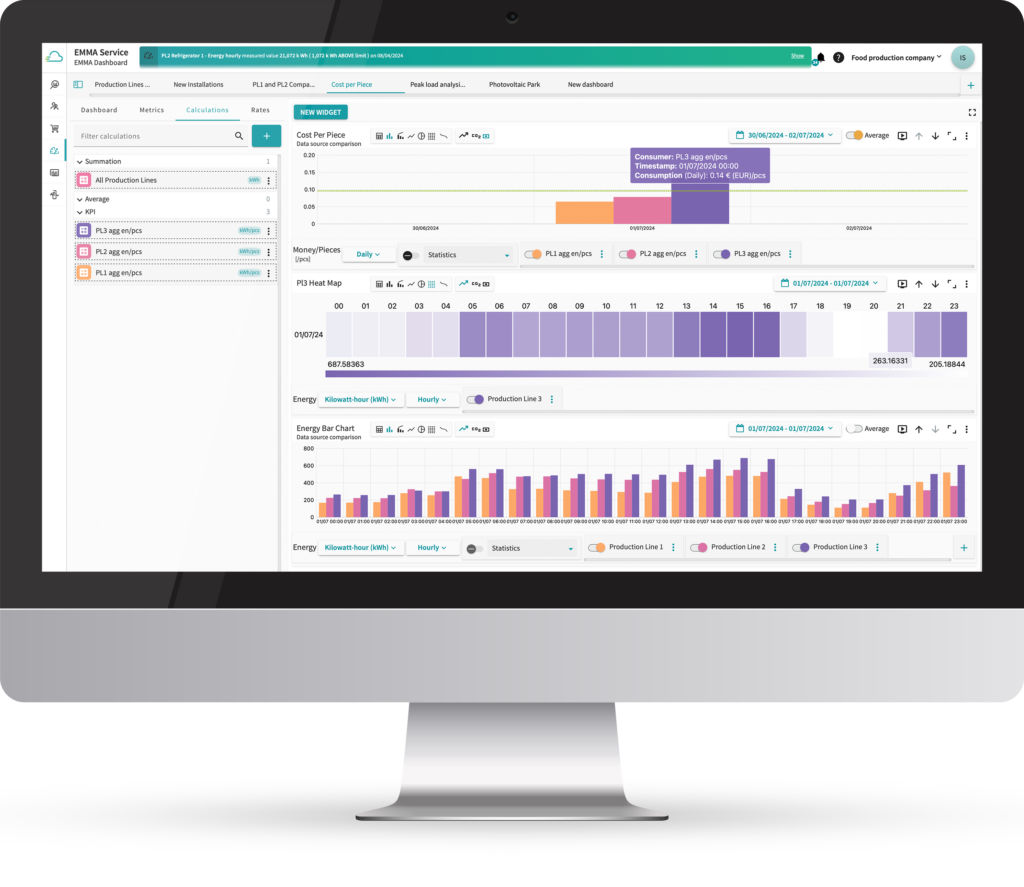
Monitoring and Analysis
Select custom time ranges and compare two data streams in a single chart. Advanced tools like heatmaps, streamlines and Pareto charts provide deeper insights.
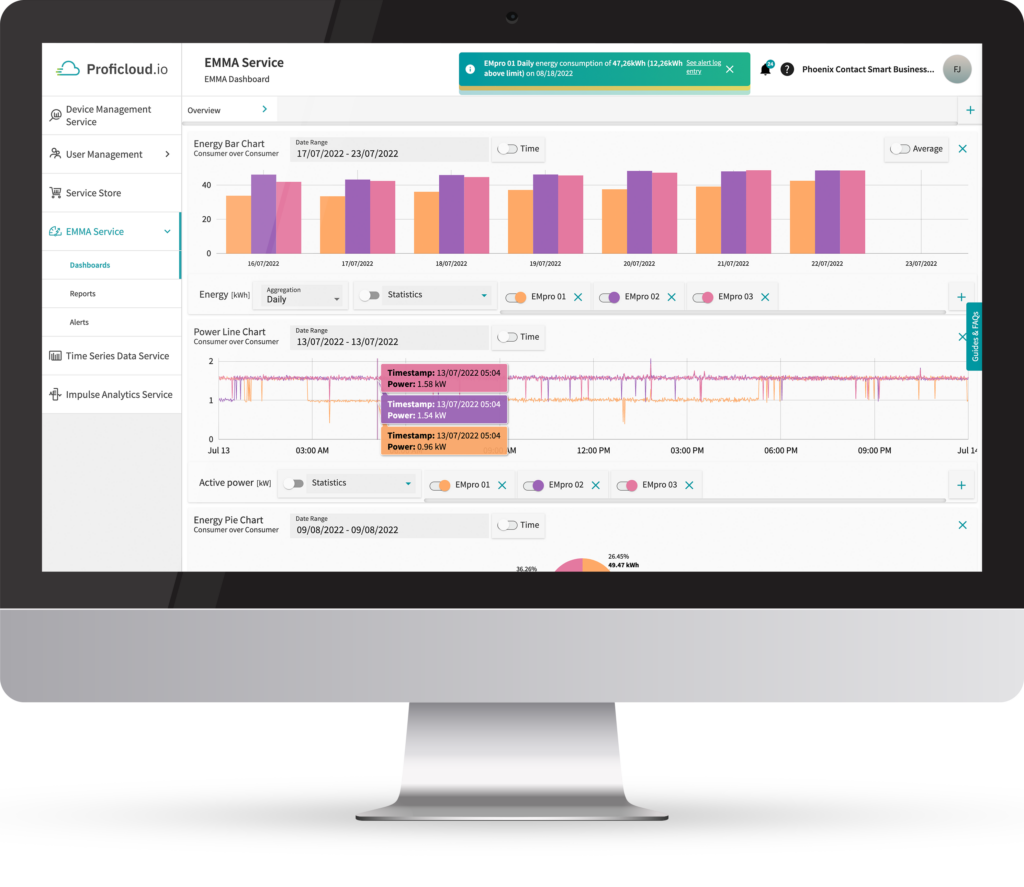
Individual Alerting
Early problem detection and targeted notifications through customizable alarm rules and various notification channels.

Cost and CO2 Conversions
Transparent cost and environmental impact analysis with automatic calculations and detailed reports.
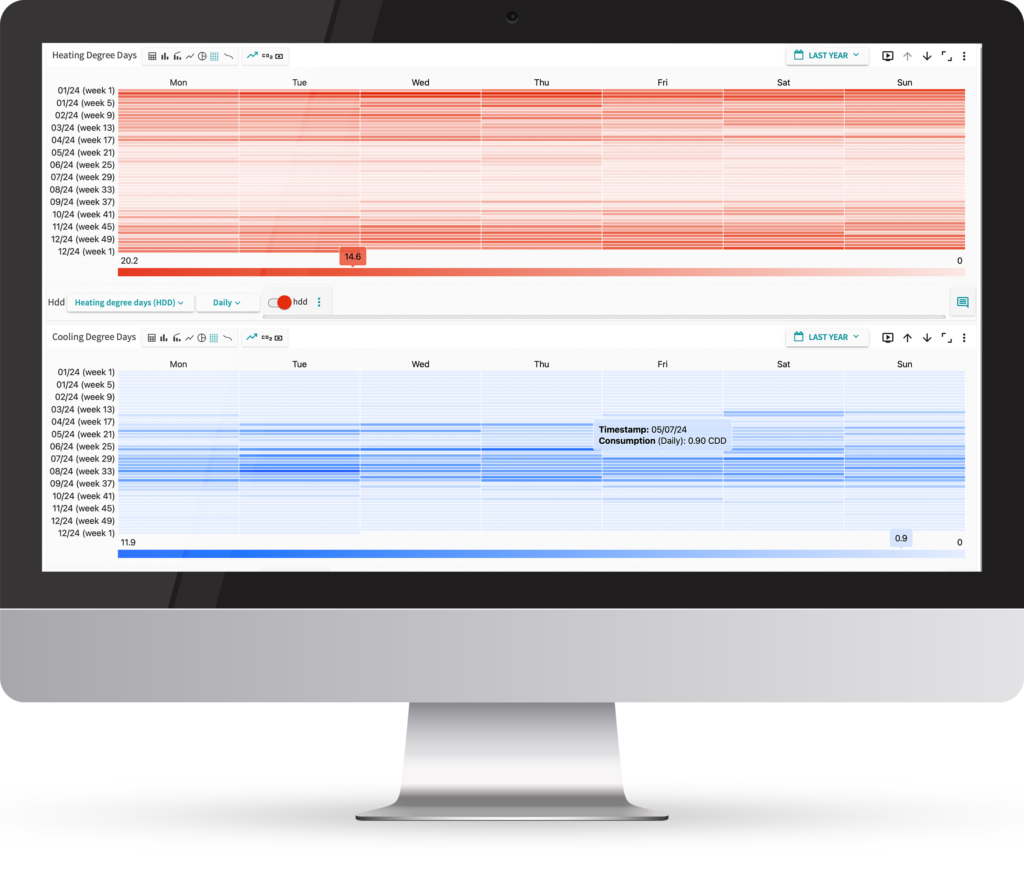
Weather Normalization
More accurate data analysis through the integration of weather data and adjustment of consumption data (heating degree days and cooling degree days).
Import and Export of Data
Easy data migration and compatibility with other systems through support for various file formats and automated processes.

Individual Reports
Tailored reports and support for performance measurement with customizable report templates and detailed analysis functions.
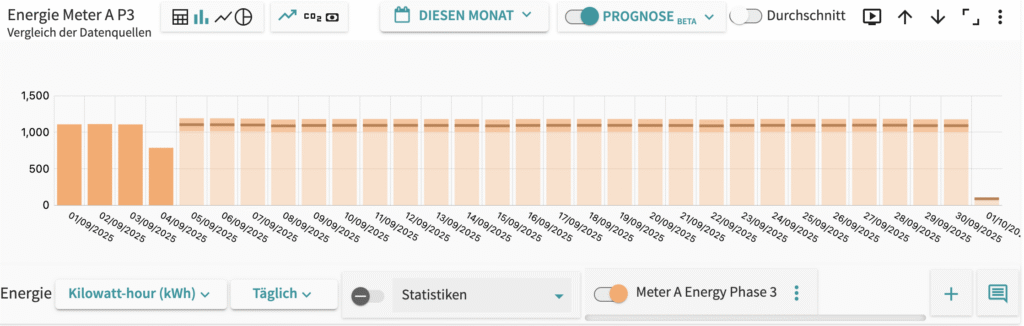
Forecasting Energy Consumption with Machine Learning
Click to expand image
Accurate energy consumption forecasts for better planning and efficiency.
The new forecast function in the Energy Management Service enables data-driven energy consumption predictions directly within the existing software solution. Based on historical consumption data trained models deliver reliable forecasts.
Forecasts are visualized in various chart types, with adjustable confidence intervals and transparent feedback on prediction accuracy. This allows users to identify potential overconsumption early, estimate cost developments and take proactive measures.
Detailed Rights and Role Management
Click to expand image
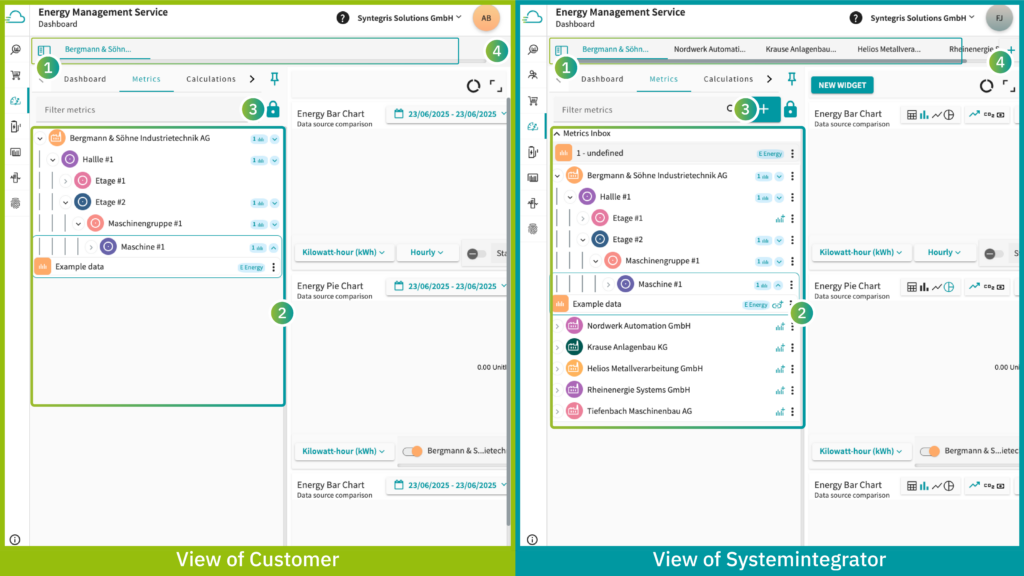
A comprehensive rights and role management system enables precise assignment of access permissions for dashboards, data streams or individual widgets. Location-based access control is also supported. Management is particularly user-friendly via selection or drag-and-drop.
Thanks to this flexibility, the Energy Management Service can also be made available to end customers. Additionally, the Smart Service can be adapted to the customer’s corporate identity (CI) to ensure a consistent brand presence.
Compliance and Eligibility for Funding

Support for DIN EN ISO 50001:2018: detailed and customizable reporting tool to help companies meet certification requirements and maintain energy management standards.
BAFA-compliant software (Germany): Access to funding and financial support by meeting funding criteria and proving eligibility.
Please inform us if your country offers similar funding or certificate options.
Energy Transparency in Production
Answer the following and more questions with the Energy Management Service:
- What are my Significant Energy Users (SEUs)?
- How can I benchmark energy performance across shifts, sites or machines?
- What is the ROI of energy efficiency investments in my production?
- How much energy does a product line consume?
- Why does one product line consume more energy than another for the same product?
- How much energy is needed to produce one piece?
- How much CO2 is being generated per unit?
- Are there anomalies or inefficiencies in energy usage?
- Need to avoid load peaks?
Start in Just a Few Steps
Start transforming your energy infrastructure in just a few steps:
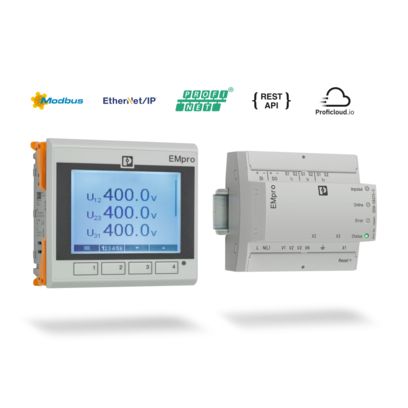
- Easily integrate hardware into the free of charge Device Management Service – enter the UUID of the hardware.
- Activate the Energy Management Service.
- Build dashboards and widgets according to your needs.
Not Ready Yet? Explore First
Try it free for 30 days
Explore the functionality of our Energy Management Service. See how simple it is to work with energy data and uncover opportunities that drive real operational impact.

Schedule Live Demo
Would you like to see the functions live? We will be happy to show you all the functions directly in live operation, make an appointment today!

Pricing
Show the Energy Management Service in the Service Store for pricing, compatibility and changelogs.
Further information


Hi, my name is Hendrik Schramm and I am glad to help you out!
Please do not hesitate to contact me. Also, if you have any suggestions or comments, just send us a message to inbox[at]phoenixcontact-sb.io and we will answer as soon as possible.