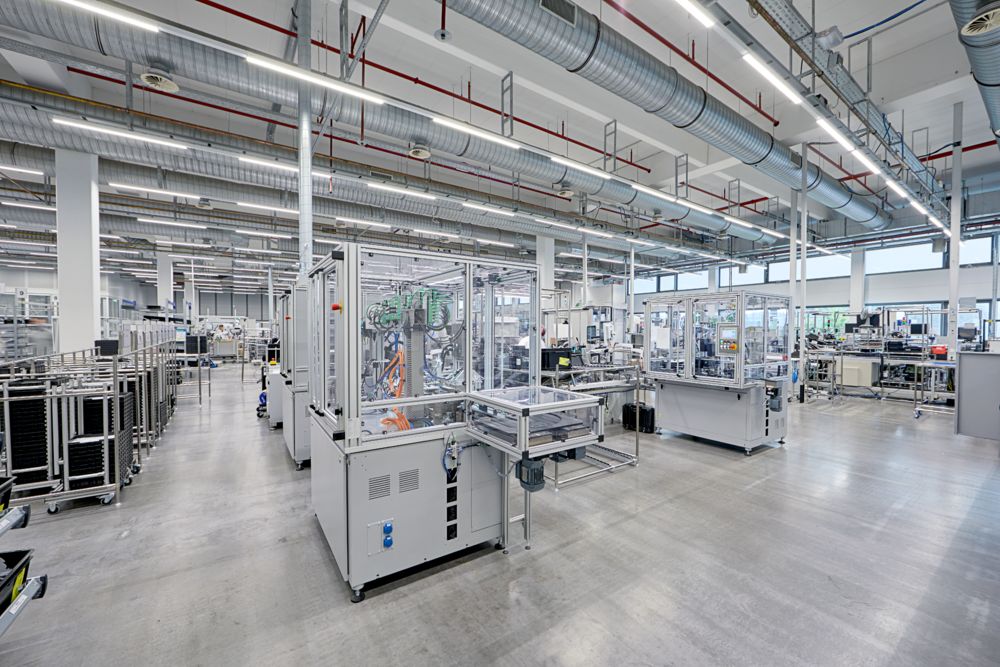
Enhancing energy efficiency in manufacturing
Installing energy monitoring meters in production to identify energy-saving potentials by machines and systems, measure efforts per part and avoid load peaks.
- Detailed insight into energy consumption
- Monitoring and analytics of incoming data
- Making evidence-based decisions
Let us assess your needs together and discuss how we can digitize your device management and utilize our analysis tools for you.
Data-driven optimization strategies for enhanced production efficiency
The company’s primary goal is to precisely record energy consumption during production. This enables the identification of energy-saving opportunities for machinery and systems and helps prevent load peaks. Additionally, continuous monitoring and data analysis allow for targeted measures to enhance overall efficiency. The company also considered the need to know the energy costs per part when implementing the new system.
In the pursuit of energy efficiency, the company explored data-driven strategies that improve upon traditional approaches.
Implementing an energy monitoring, management and analysis system is essential for achieving company targets. It helps identify untapped savings, comply with legal regulations, meet EU sustainability goals and enhance overall competitiveness.
Technical hardware setup in the production
Technical Implementation with Phoenix Contact hardware
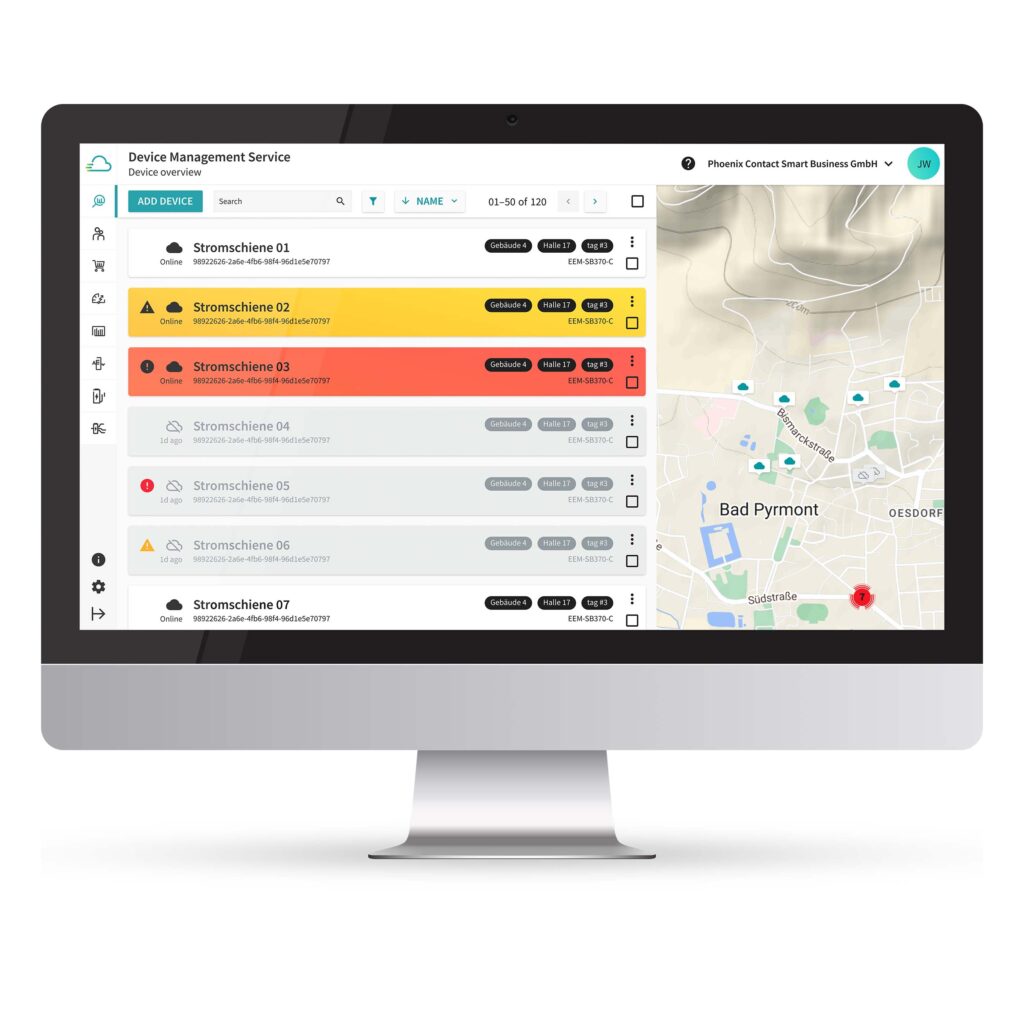
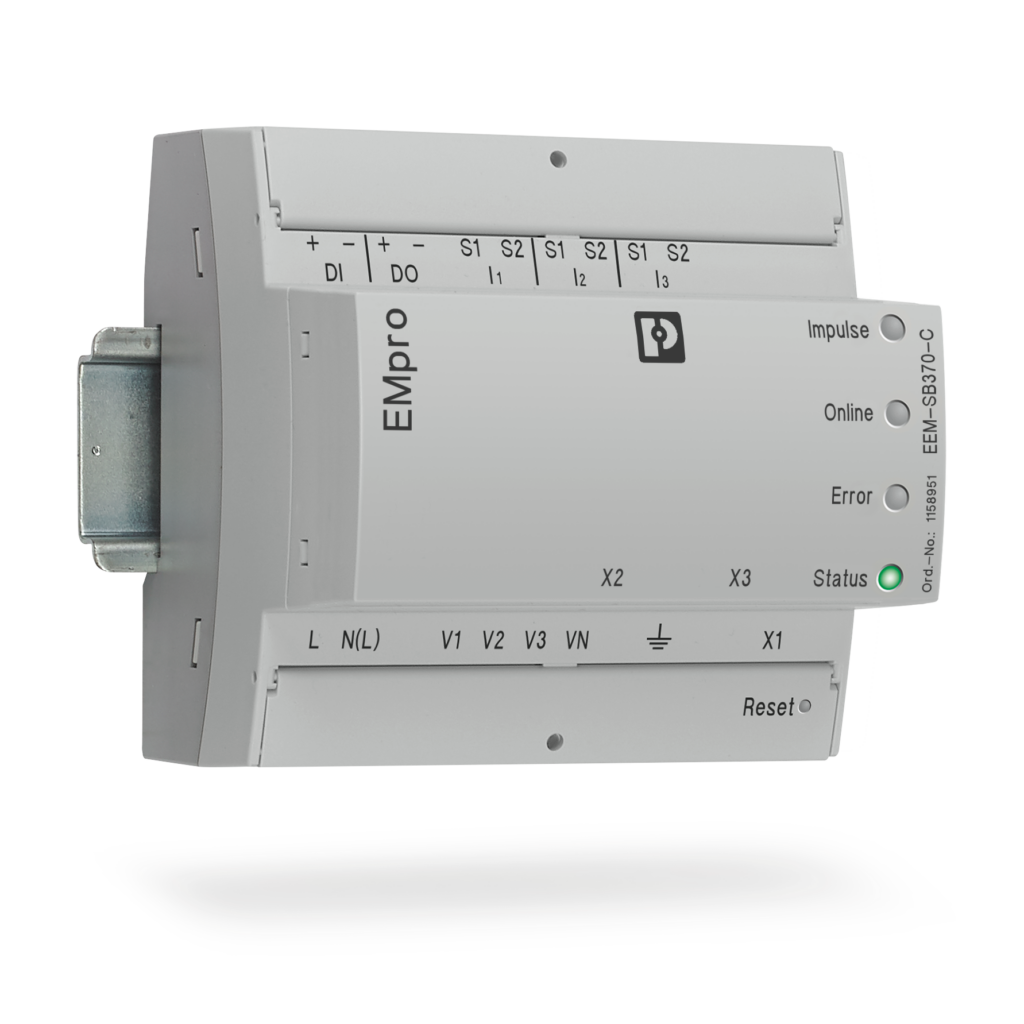
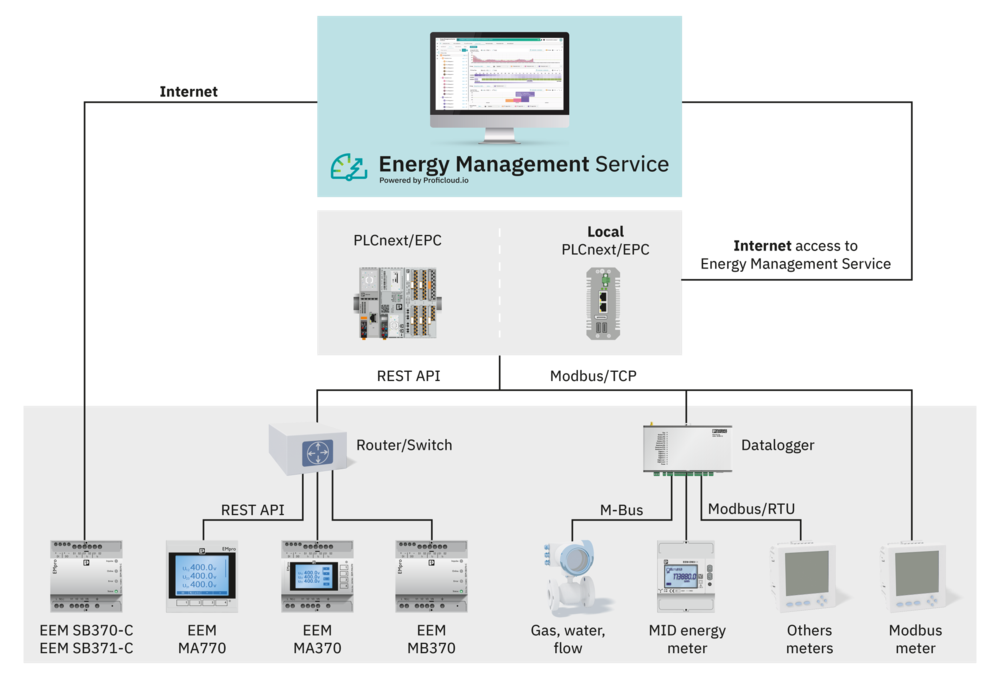
To make energy consumption within a production hall more transparent, the company has equipped all production machinery in one of the production halls with IoT-enabled EMpro energy meters. These multifunctional energy meters capture energy data and offer various ways to communicate this information to higher-level control and management systems. Configuring and integrating the energy meters is straightforward using the web-based, user-guided installation assistant. Additionally, EMpro energy meters allow direct cloud connectivity to Proficloud.io, eliminating the need for an additional gateway.
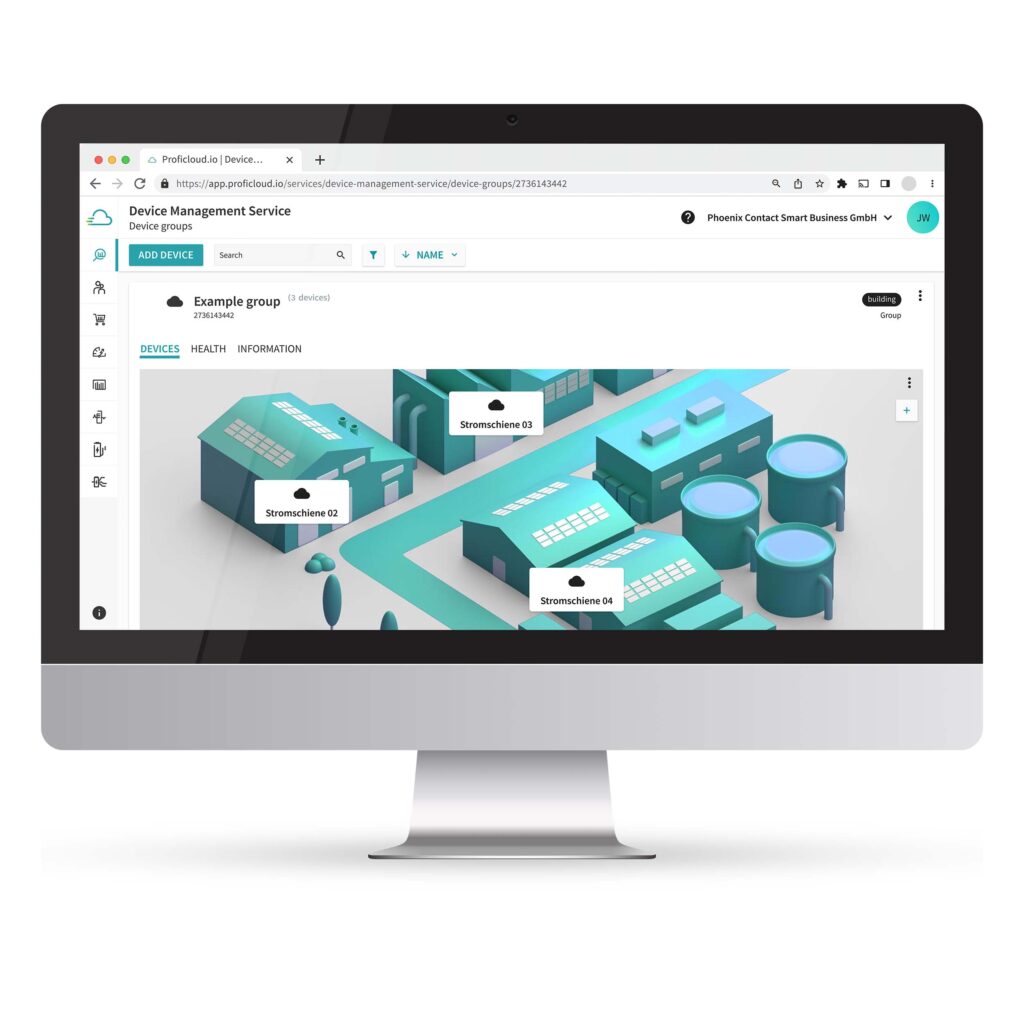
The picture illustrates all possible ways to connect hardware to the Energy Management Service via the Device Management Service. In this use case, only the IoT-enabled EMpro energy meters are used.
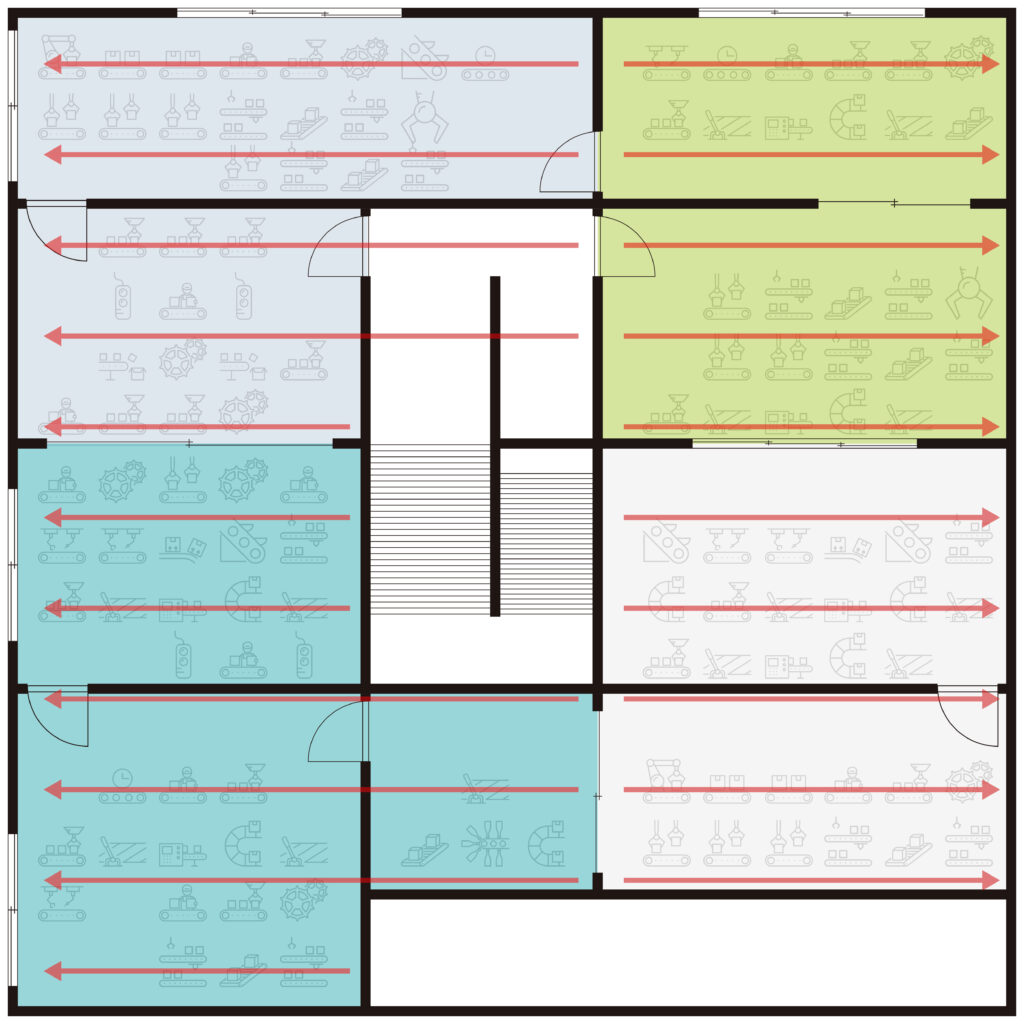
- Each color range is a montage group: The different color areas are assigned to different assembly groups in the production. These groups are responsible for various processes.
- Red lines are power rails: The red lines represent the power rails in the facility. Power rails are electrical conductors used for distributing electric current.
- Installation: There are 26 device combinations distributed and connected to two control cabinets. Each combination consists of an EMpro energy meter and three Rogowski coils.
Maximize value with Smart Services
The Smart Services of Proficloud.io added the needed digitalization component of the project.
Energy Management Service
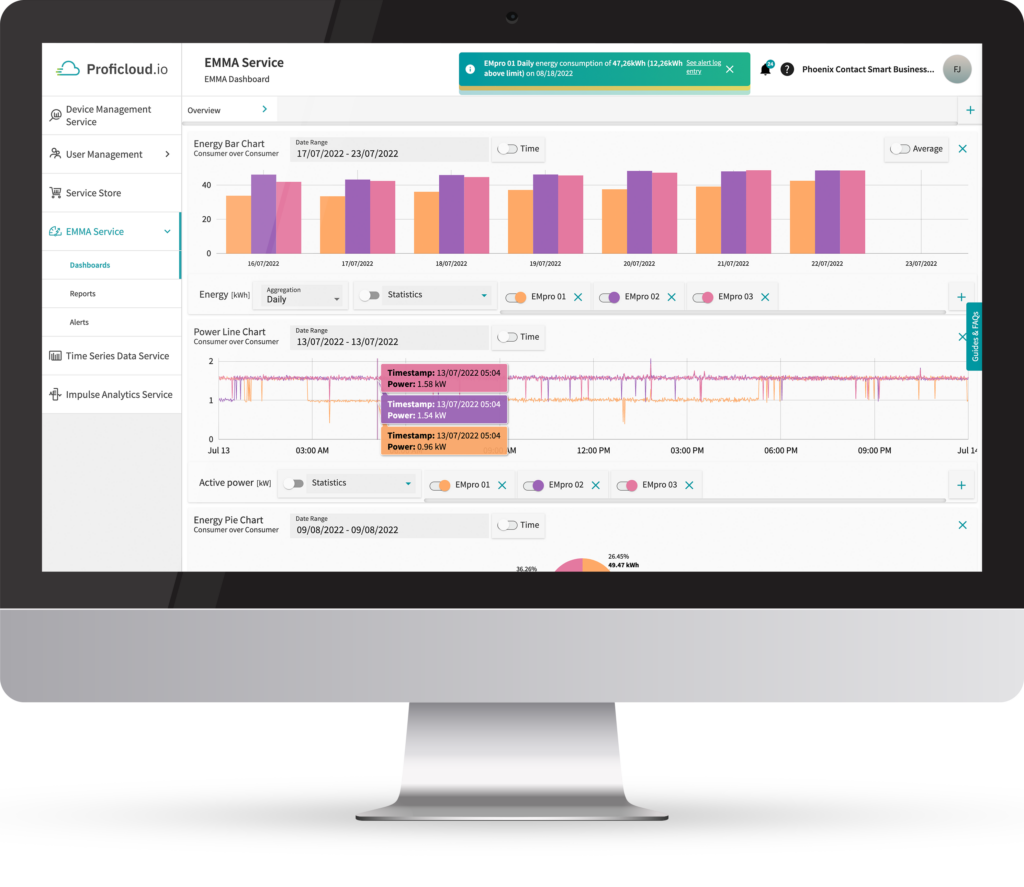
Energy monitoring, management and analysis
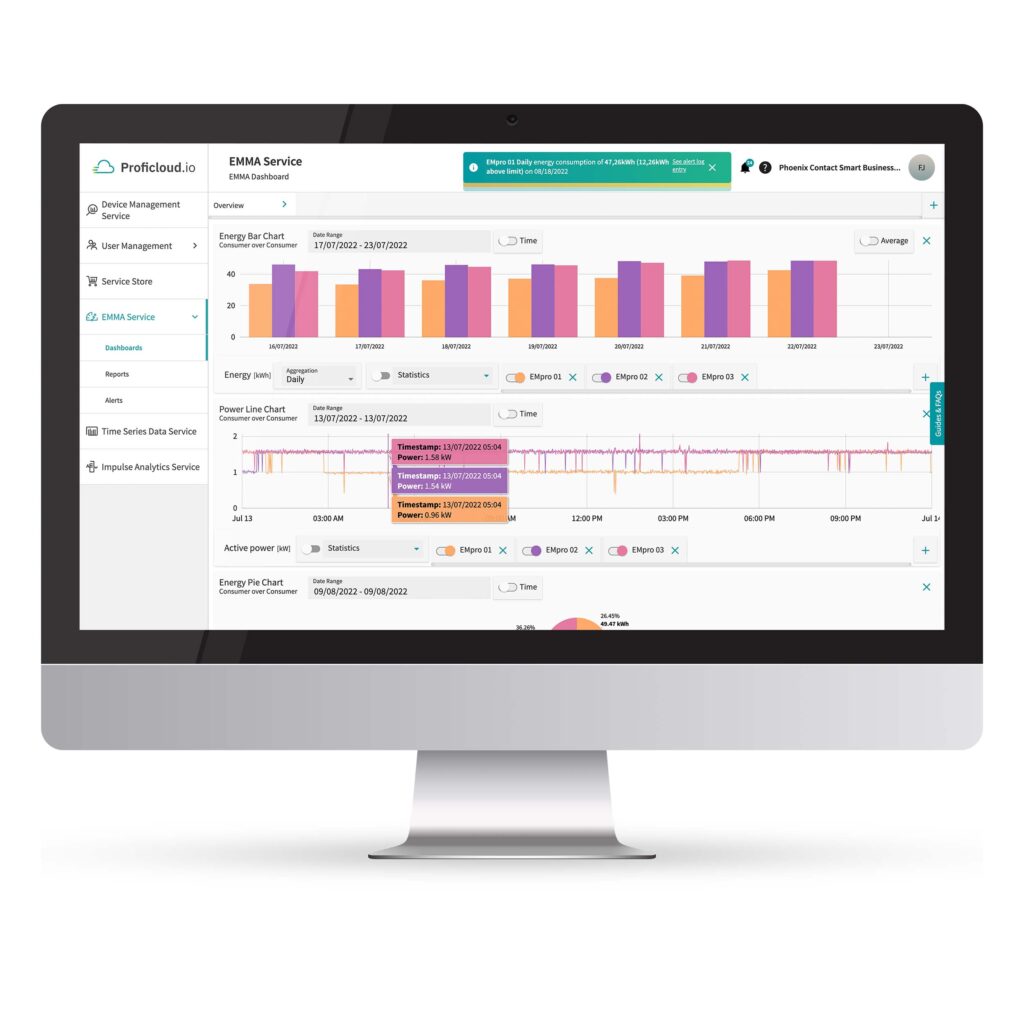
With the Energy Management Service, dashboards for data analysis are easily created by combining various devices into a single widget for efficient comparison. The Smart Service allows for the generation of detailed reports on Energy Performance Indicators (EnPI) across different time periods, which can be easily downloaded and shared as PDFs. Additionally, alerts can be set up for Proficloud.io-wide notifications on limit over- or underruns, providing an overview of peak consumption.
View into the dashboards of the project
Comparing energy consumption of machinery and systems
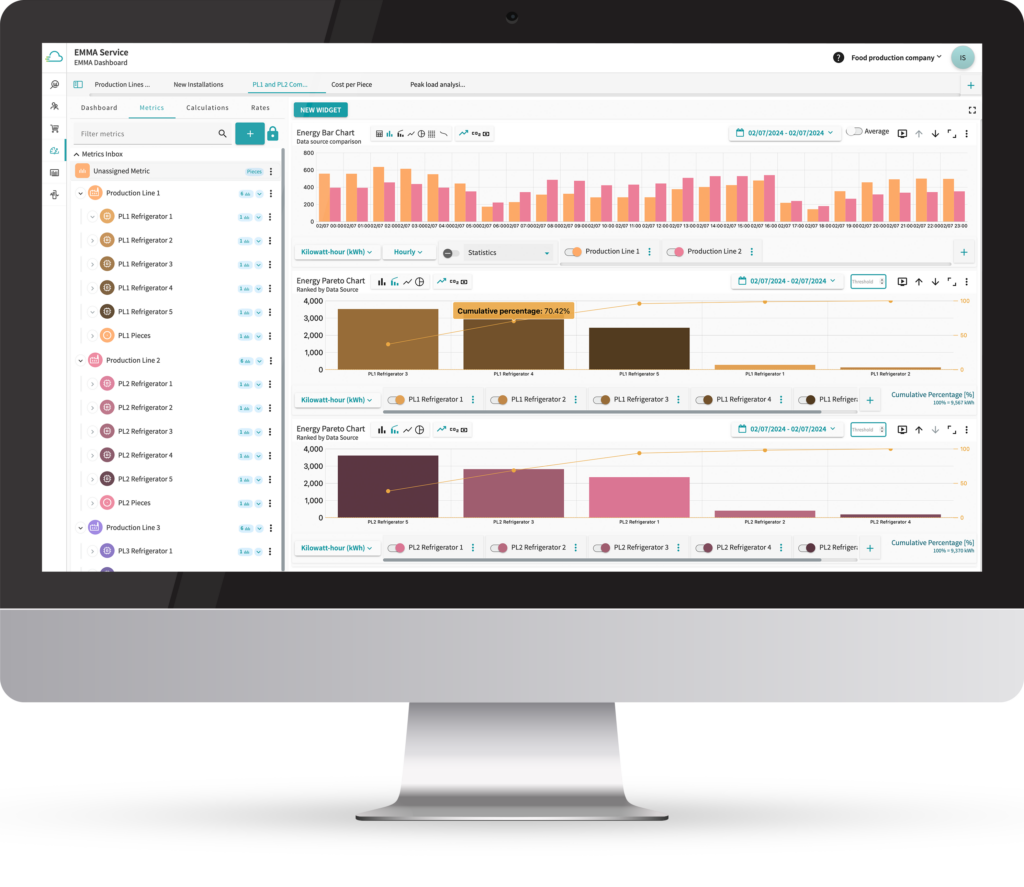
The bar chart compares the hourly energy consumption between two production lines. It is clearly visible that the consumption of Line 1 is significantly higher than that of Line 2 during the night hours. This changes in the morning hours when a new production batch is started. The drop and rise can be seen again in the afternoon.
The Pareto chart provides an immediate overview of the largest consumers. This allows monitoring of the SEUs (Significant Energy Uses) and observing changes. It also shows the percentage share of each SEU.
Calculating costs per part
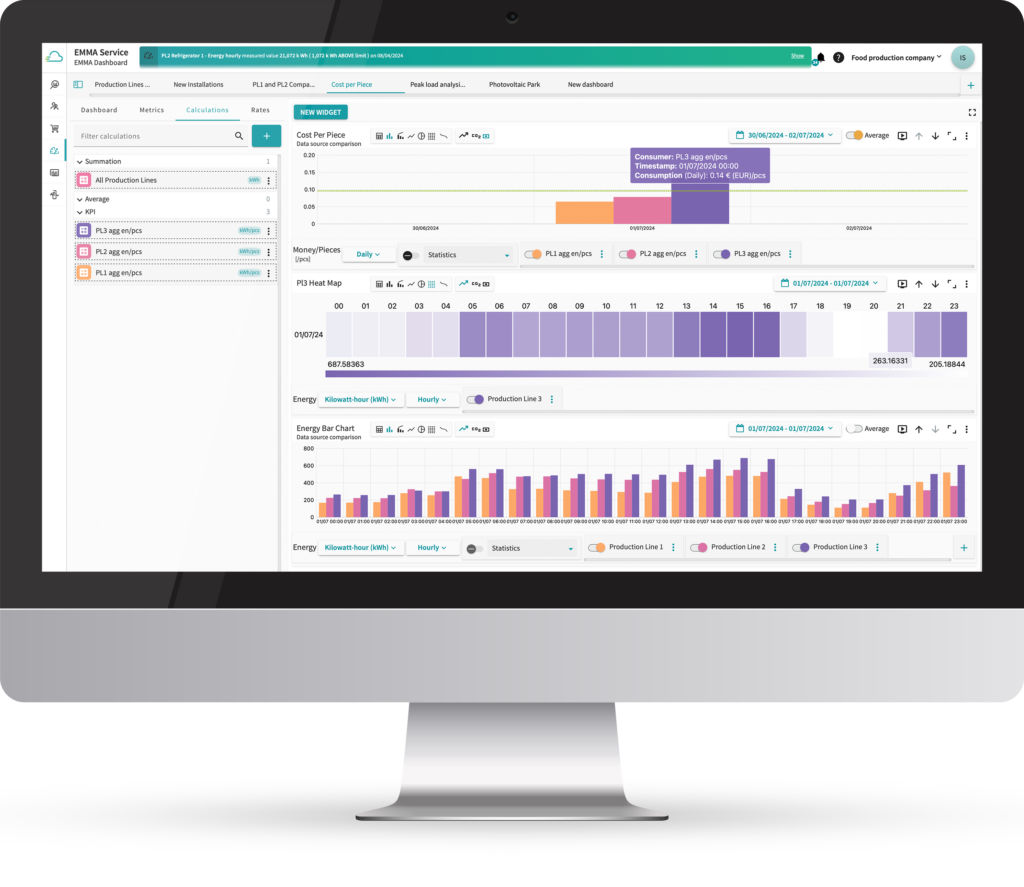
The cost per part widget shows a detailed breakdown of costs for each part. Another widget, the heat map, visualizes the cost distribution, highlighting more expensive areas in warm colors. Finally, an energy bar chart displays the energy consumption for producing each part, which affects the cost per part.
Avoiding load peaks by identifying high-consumption machinery
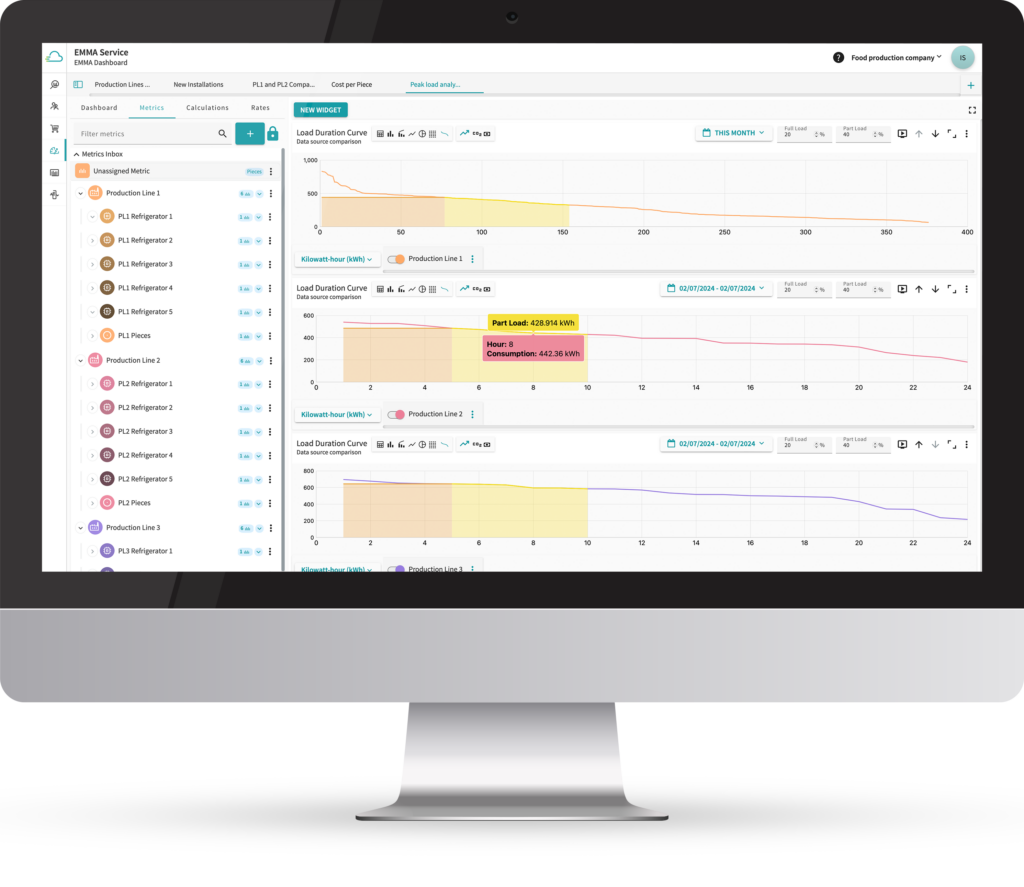
Using the load duration curve, various analyses can be conducted. The load duration curve displays measured values sorted by magnitude. Load or consumption peaks can be easily identified as they appear on the far left as the largest values.
The load duration curve serves as a tool to determine the base load and gradually reduce it. As with all diagrams, any medium can be analyzed, e.g., gas, water, electrical energy.
The load duration curve can also be used to determine the correct sizing of a CHP (Combined Heat and Power) plant before acquisition, as a common application is to cover base load or cap peak load.
Energy monitoring and efficiency enhancement in production
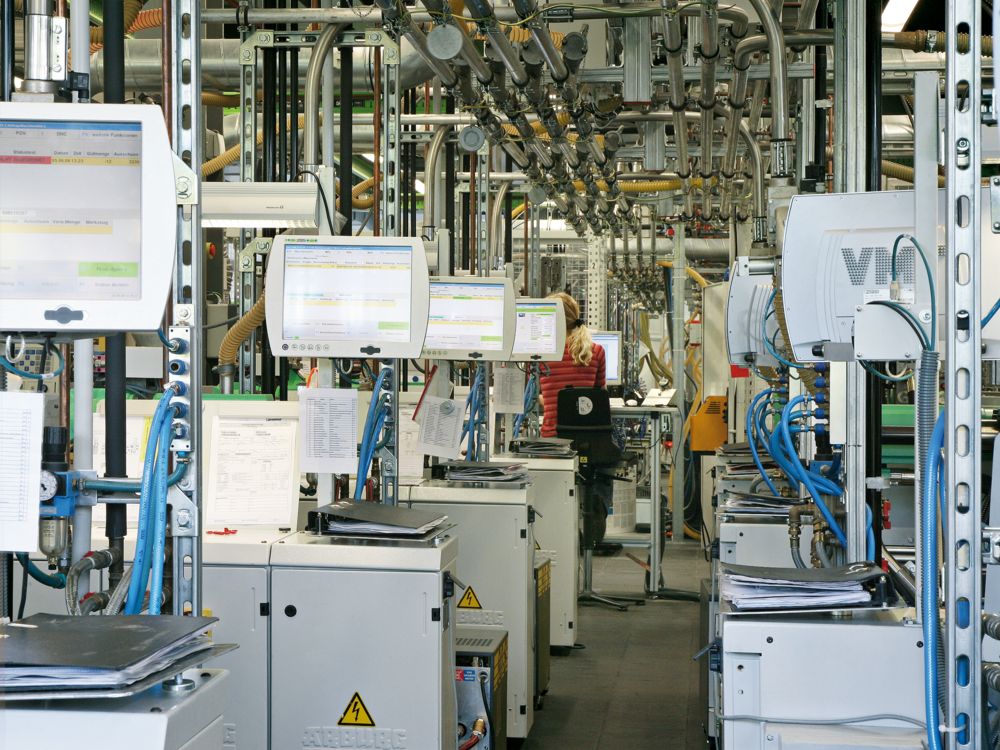
In the company’s production facility, energy monitoring devices have been installed to track energy consumption data. The IIoT platform Proficloud.io, which includes the powerful Energy Management Service for comprehensive data analysis, is utilized. The following three use cases were addressed:
1. Comparing energy consumption of machinery and systems: By continuously monitoring energy usage, the consumption of individual machines and systems, as well as comparing the data between machines, can be analyzed. This allows for the identification of potential savings and optimization of energy utilization.
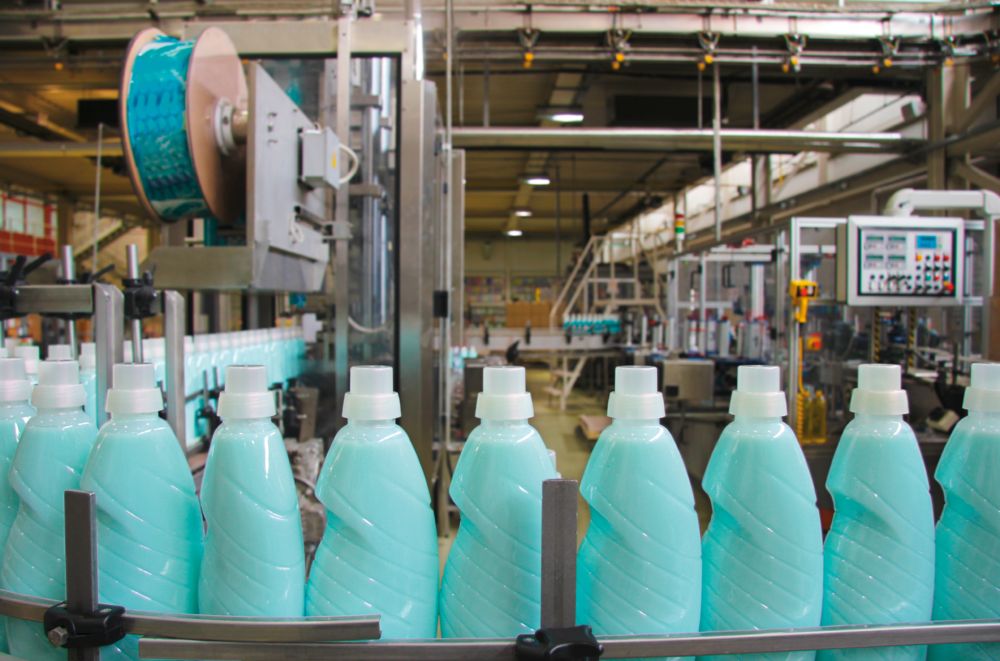
2. Calculating costs per part: The Energy Management Service enables the company to determine the costs associated with each produced part. By linking energy consumption data with production records, they gain precise insights into the expenses for every manufactured item.
3. Avoiding load peaks by identifying high-consumption machinery: Through energy consumption data analysis, machines that consume excessive energy can be pinpointed. This helps to prevent load peaks and enhance overall production efficiency.
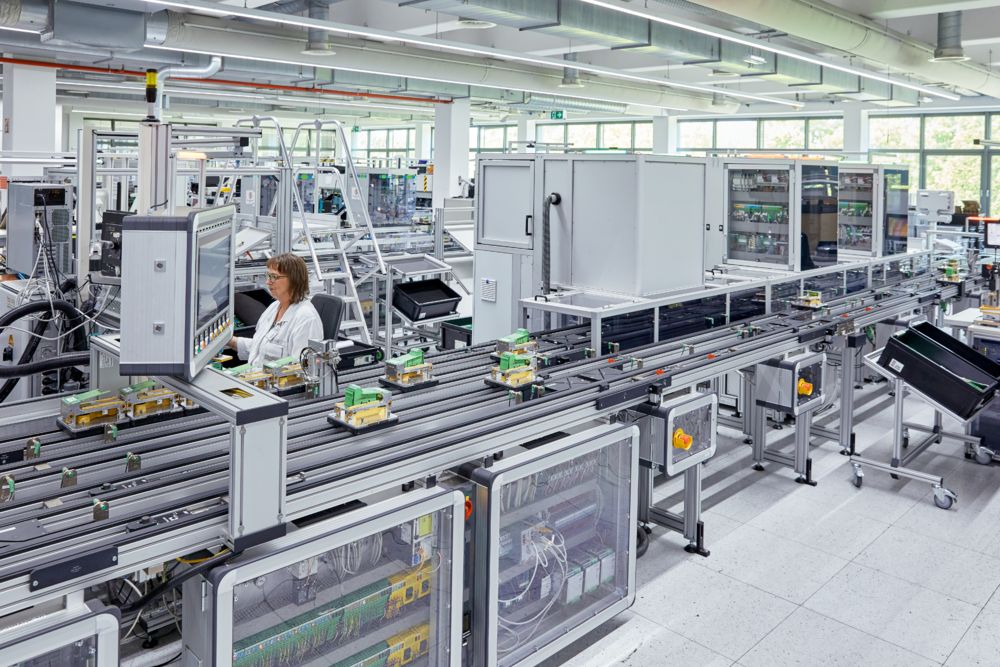
The primary objective of these measures is to identify energy-saving opportunities and streamline production processes. By combining energy monitoring with data-driven insights, the company creates a sustainable and cost-effective production environment.
Achieving company targets through implementation of an energy monitoring, management and analysis system
Energy monitoring, management and analysis are crucial in growing as a company and to meet the following goals:
High energy costs and untapped savings potential: By facing rising energy costs, effective monitoring and analysis help to identify untapped savings potential.
Carbon footprint and legal regulations: Climate change and the need to reduce carbon emissions have led to new laws and regulations. The goal is to minimize the carbon footprint to operate in a more sustainable manner and thereby follow new legal requirements.
Sustainability: Actively engaging in energy management to meet company targets.
To achieve this agenda, data visualization and analysis need to be set in place. Analyzing energy consumption data helps to identify saving potentials and uncover optimization opportunities.
Overall, energy management is a strategic topic that not only reduces costs but also contributes to the sustainability and competitiveness of the company.
Get in contact

Hi, my name is Hendrik Schramm and I am glad to help you out!
Please do not hesitate to contact me. Also, if you have any suggestions or comments, just send us a message to inbox[at]phoenixcontact-sb.io and we will answer as soon as possible.


