EMMA Service has evolved into the Energy Management Service

Historical data with virtual devices
Data sent to the EMMA Service from connected devices can now be augmented with data from CSV files in the individual dashboards, which includes energy as well as air pressure. This way, different data sources (and measurement data from times when Proficloud.io was not yet actively used, but data was collected) can be compared with each other.
Use this feature to make your knowledge of your energy consumption or air pressure of your air reservoir (whether connected to cloud, or offline) even more transparent and draw conclusions.
Reports
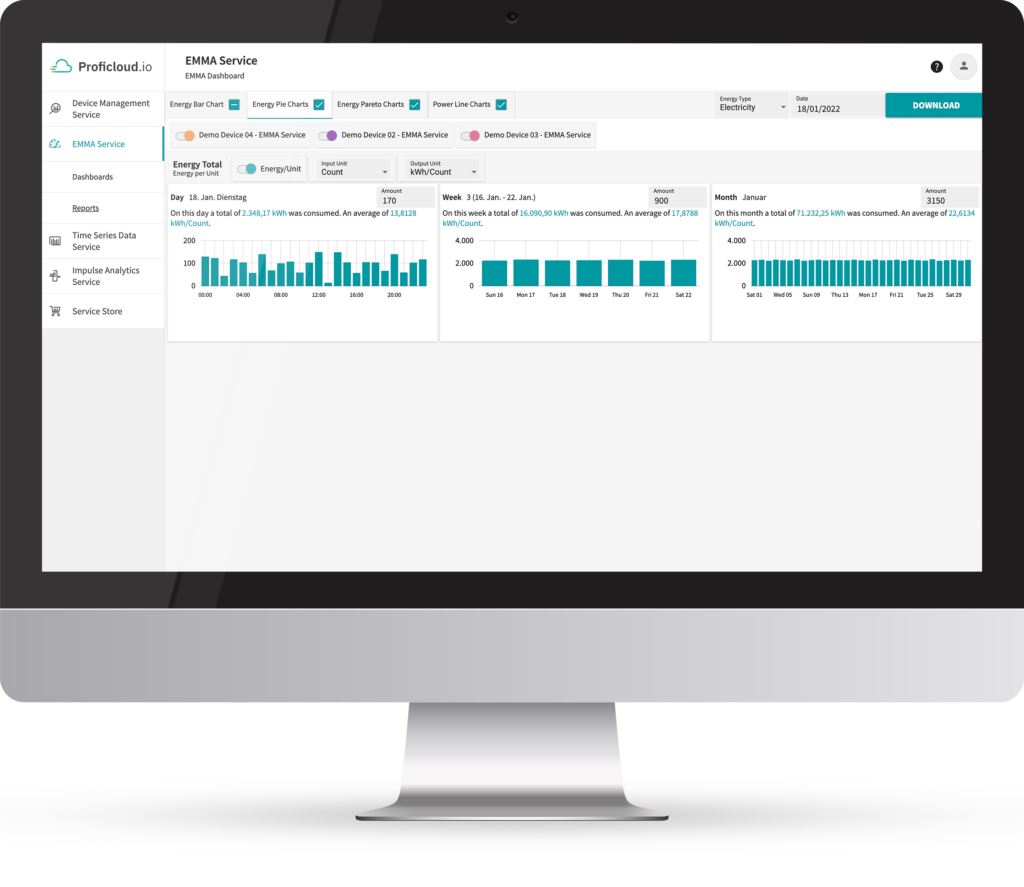
In the new reporting of the EMMA Service, you can now display EnPIs (Energy Performance Indicator – energy consumption per selectable metric, e.g. kg, ton or number of unit) based on your devices. With the energy performance indicators you can get an insight in how much energy you can potentially save per unit of production.
The time-based display gives you insight into total consumption over days, weeks or even months and the according average per unit which allows you to compare these total numbers and averages with each other. Draw conclusions about irregularities and understand your energy consumption.
With the new reports in the EMMA Service, conclusions can also be shared as an export outside of Proficloud.io by recording the energy data. Currently an export as PDF is possible – so you can also share your newfound knowledge conveniently.
Create your free Proficloud.io account and check out the EMMA Service in the Service Store!

