What’s Behind the Forecast Function? A Look at the Machine Learning Logic
Energy forecasting isn’t magic—it’s data science in action. For businesses aiming to optimize energy use and meet compliance standards, understanding how forecasts are generated builds trust and confidence.
In this article, we’ll explain how the Forecast feature in the Energy Management Service works, what data it uses and why confidence intervals matter.
Why Transparency Matters
When you rely on forecasts for strategic decisions—whether for budget planning, ISO 50001 audits or operational efficiency—you need to know the logic behind the numbers. Machine learning models provide powerful predictions, but transparency ensures that these insights are credible and auditable.
How the Forecast Models Work
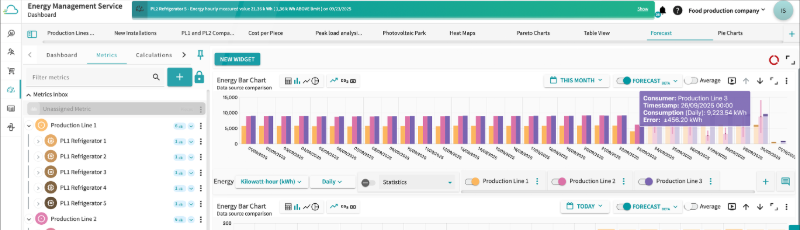
The Forecast function uses machine learning algorithms to detect patterns in historical consumption. Here’s what happens behind the scenes:
- Data Collection: Historical energy consumption from your meters.
- Pattern Recognition: The model identifies recurring patterns and anomalies in your data.
- Prediction Generation: Based on these patterns, the system calculates future consumption values and updates them continuously as new data arrives.
This dynamic approach ensures that forecasts are not static—they evolve with your operations and environment.
What Data Flows Into the Forecast?
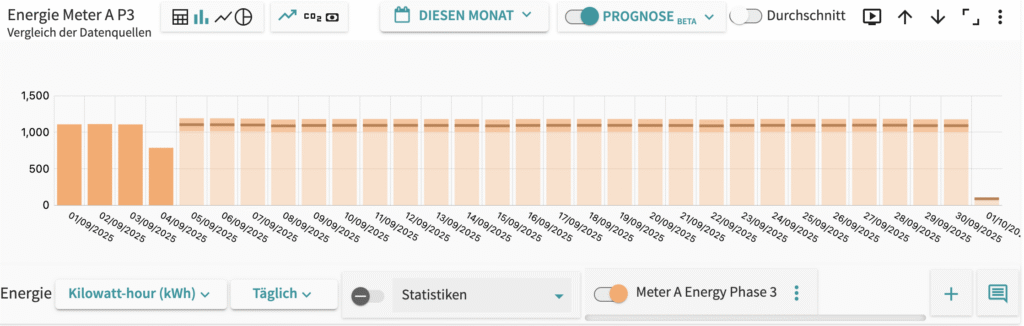
Transparency means knowing what drives the predictions. Historical consumption data is used for baseline analysis. By integrating this data source, the forecast reflects real-world conditions rather than theoretical assumptions.
Yet historical data does more than simply provide a starting point. These patterns are clearly visible in the historical data, which captures seasonal fluctuations, long-term growth trends and the impact of past external events such as economic shifts or weather anomalies. This allows the forecast to recognize recurring cycles and anticipate how similar conditions might influence future demand.
At the same time, relying on historical consumption data highlights the importance of data quality: gaps, inconsistencies or outdated records can distort the picture. By carefully cleaning and validating the dataset, the forecast gains credibility and robustness.
Ultimately, historical data acts as the backbone of predictive modeling. It anchors projections in reality, ensures that trends are not imagined but observed and provides a transparent foundation.
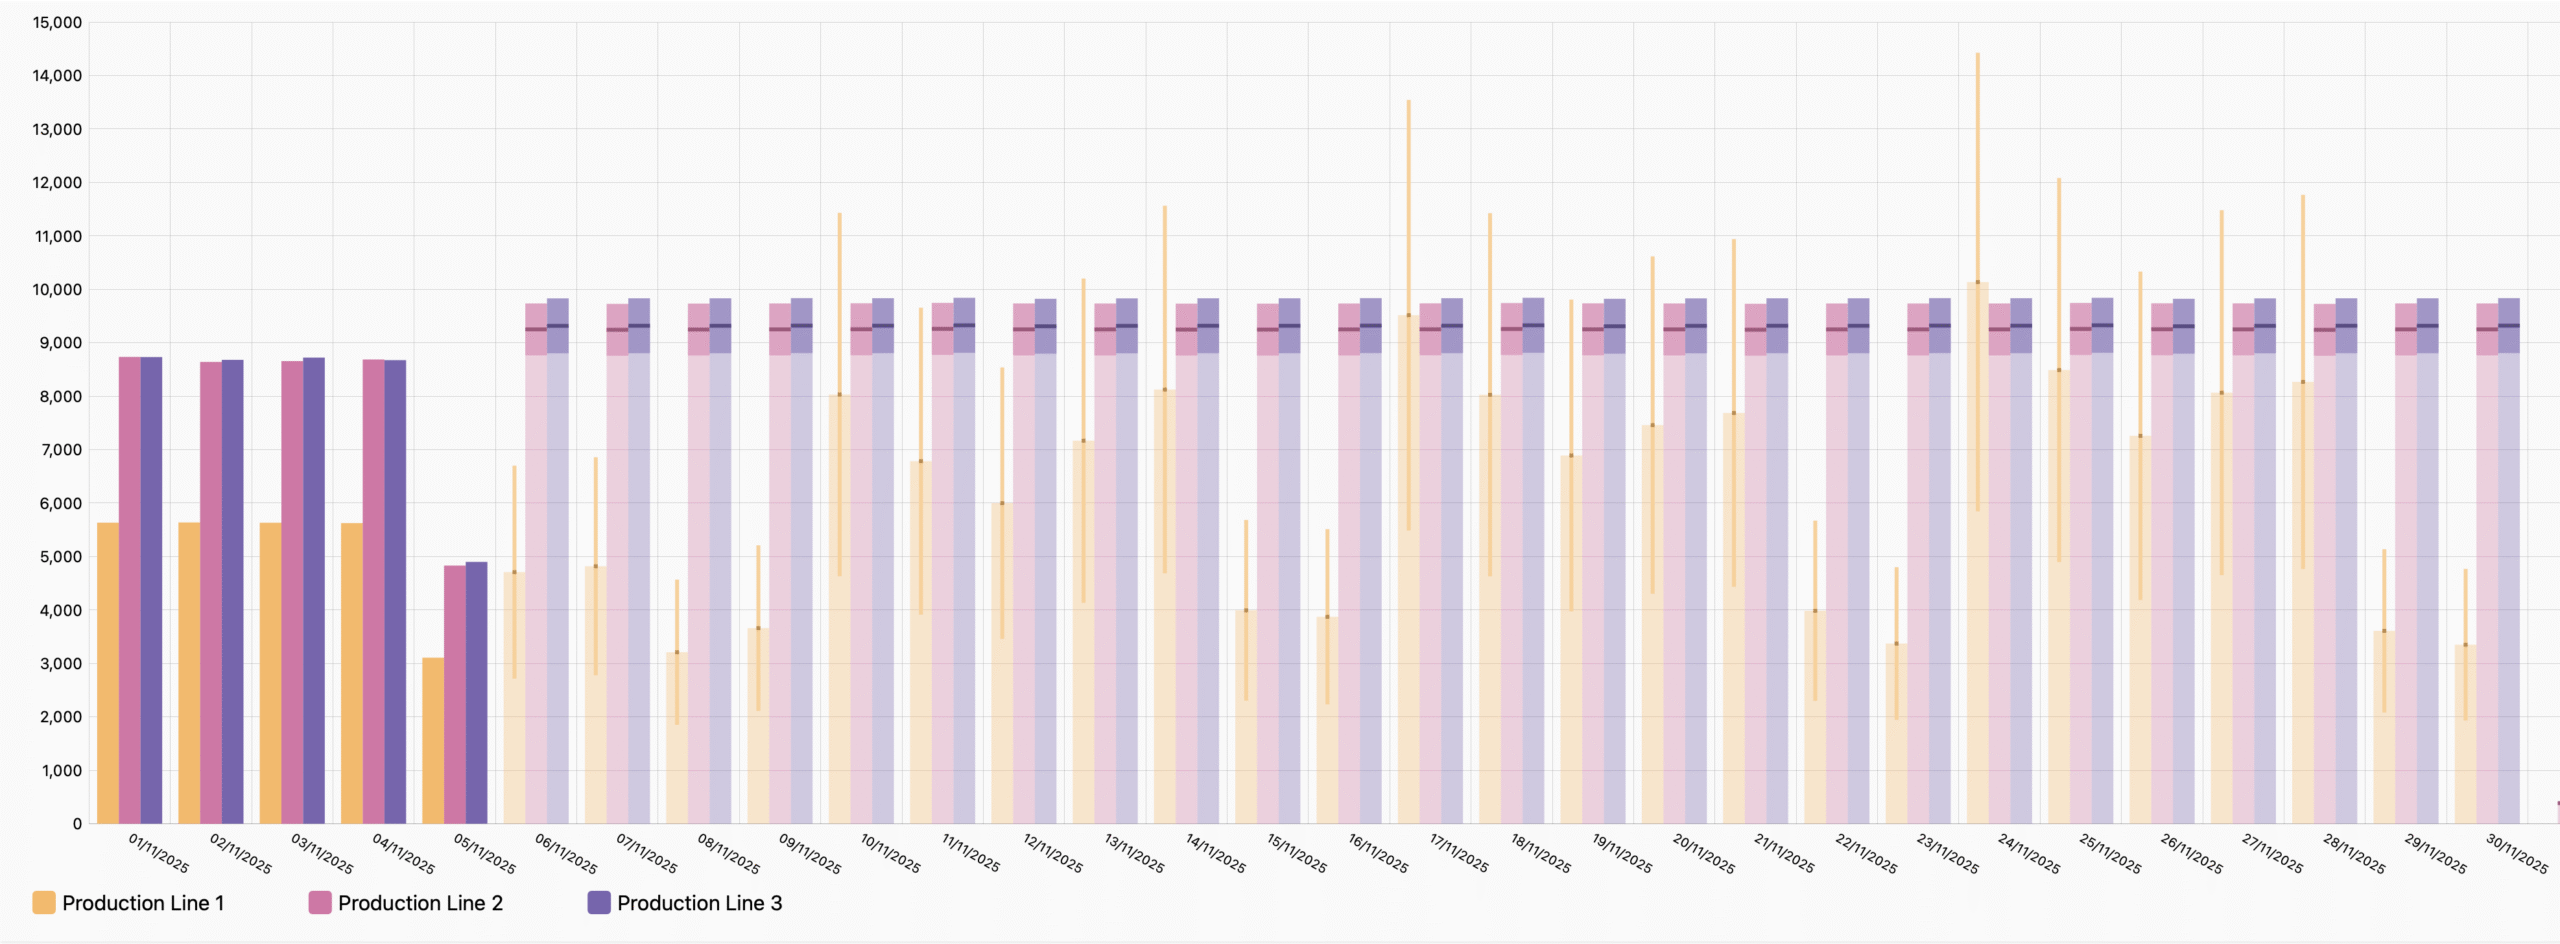
Confidence Intervals: Why They Matter

Every forecast includes a confidence interval, which shows the range within which actual consumption is likely to fall. This is critical for decision-making and audits because:
- It provides clarity on prediction accuracy
- It helps you assess risk and uncertainty
- It builds trust with auditors and stakeholders
Confidence intervals turn forecasts from simple estimates into transparent, reliable tools for compliance and planning.
Why This Matters for Your Business
- Better planning: Accurate predictions for budgets and operations
- Compliance support: Clear evidence for ISO 50001 audits
- Risk management: Understand uncertainty before making decisions
Energy Management Service in Detail
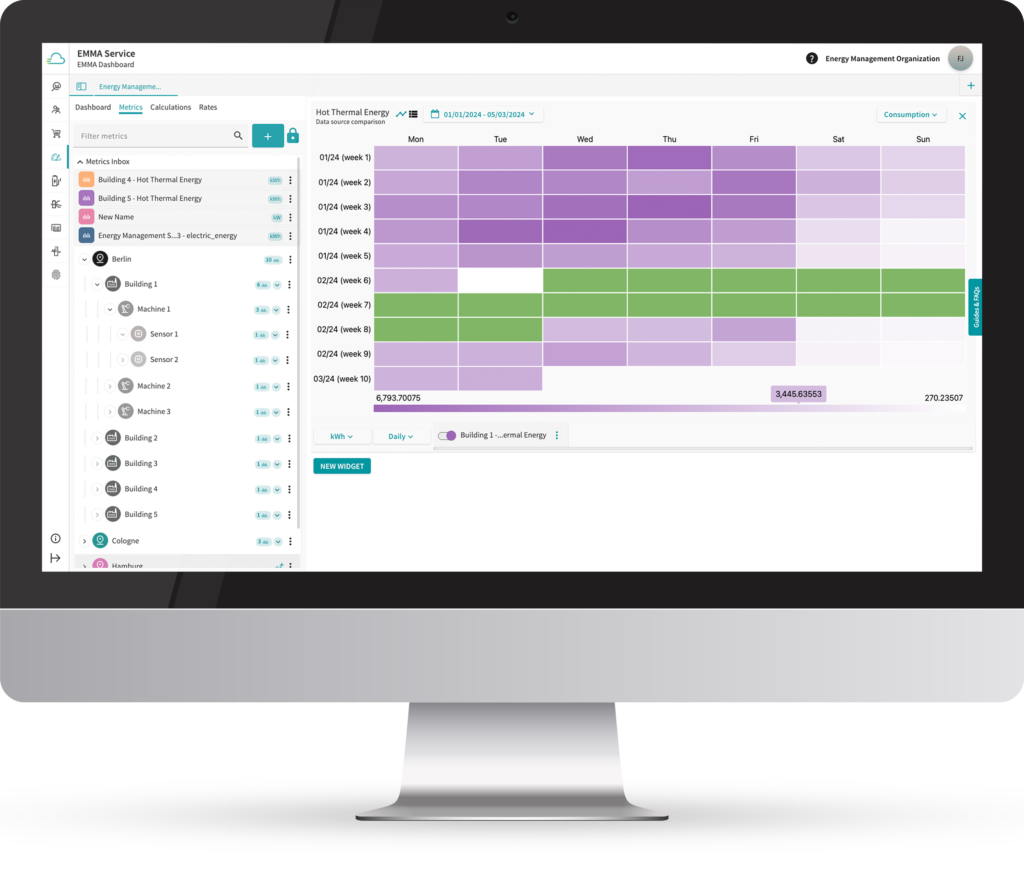
The Energy Management Service offers a comprehensive solution for monitoring, managing and analyzing your energy consumption anytime and anywhere.
Explore Live Insights
Experience smart energy management – try it free for 30 days
Explore the functionality of our Energy Management Service. See how simple it is to work with energy data and uncover opportunities that drive real operational impact.

Schedule live demo
Would you like to see the functions live? We will be happy to show you all the functions directly in live operation, make an appointment today!