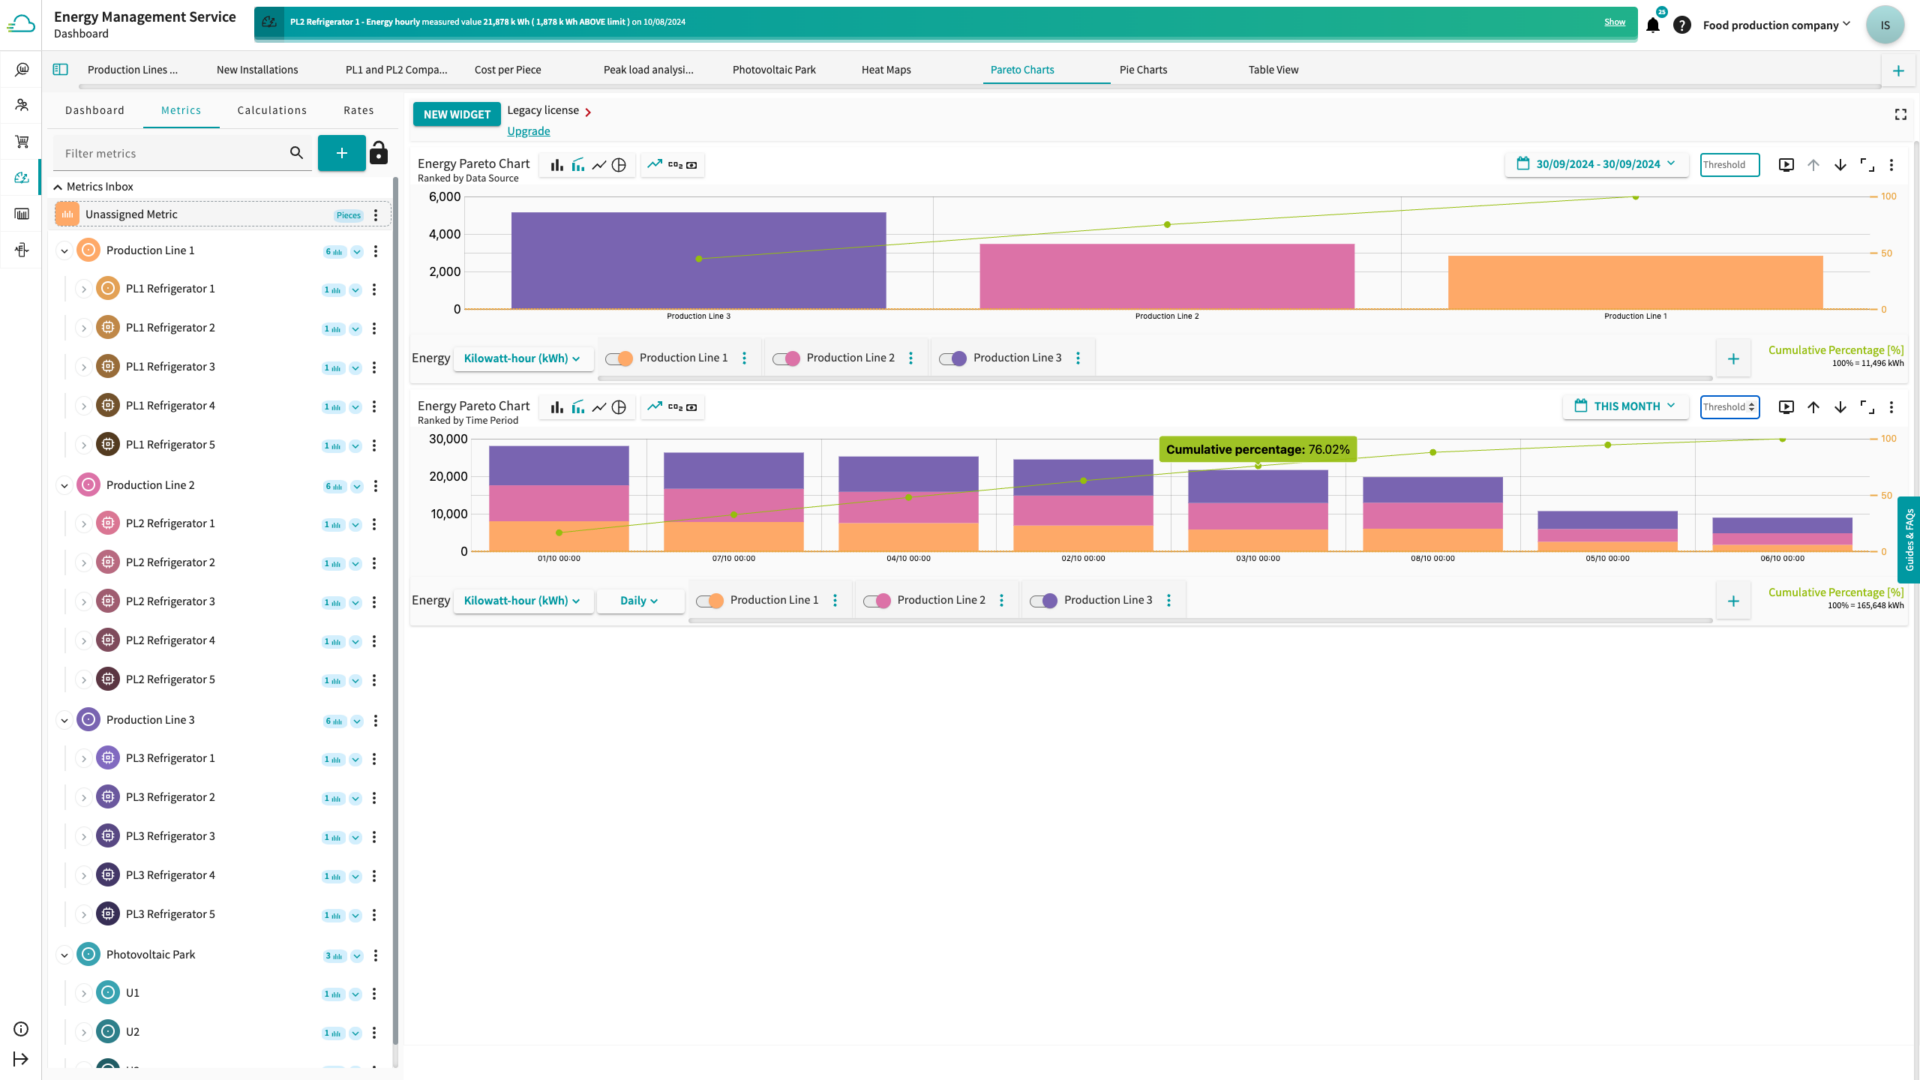
Proficloud.io’s Energy Management Service
The Energy Management Service (Energy, Monitoring, Management, Analytics) is tailored to the needs of Energy Managers. It provides a plethora of visualization options to help understand energy data beautifully.
Starts at € 36.00
Pricing of the Energy Management Service
Most Popular
Energy Management Service Pro licence
€ 3092
per year¹
Use the full array of features from the Energy Management Service
- Unlimited data retention and availability
- 100 Metric included
- Unlimited number of users
- Annual subscription
- Unlimited feature use
Energy Management Service Metric 50 licence
€ 2325
per year¹
The Energy Management Service scales with your company²
- Additional 50 metrics to use
- 46.50 €/Metric
- Uncompressed data
- Minutely resolution
Energy Management Service Metric 100 licence
€ 4125
per year¹
The Energy Management Service scales with your company²
- Additional 100 metrics to use
- 41.25 €/Metric
- Uncompressed data
- Minutely resolution
Energy Management Service Metric 200 licence
€ 6744
per year¹
The Energy Management Service scales with your company²
- Additional 200 metrics to use
- 33.72 €/Metric
- Uncompressed data
- Minutely resolution
Energy Management Service Starter licence
€ 36
per year¹
Get to know Energy Management Service for your POC
- Unlimited number of users
- Trial period of 1 year
- 4 metrics included
Energy Management Service Custom setup³
€ 1765
one time fee¹
Design draft for a customised Energy Management Service²
- Your company logo
- Colour scheme customisation
- Individual URL
¹ excluding taxes
² requires Energy Management Service Pro licence
³ Energy Management Service Custom setup requires Custom license and vice versa
New functionalities of the Energy Management Service
- Change to a metrics- and feature-based licence model
- Renaming EMMA to Energy Management Service
- Many more units that you can use to create a customised KPI or EnPI.
- You can now add a source to an existing metric to enter historical data
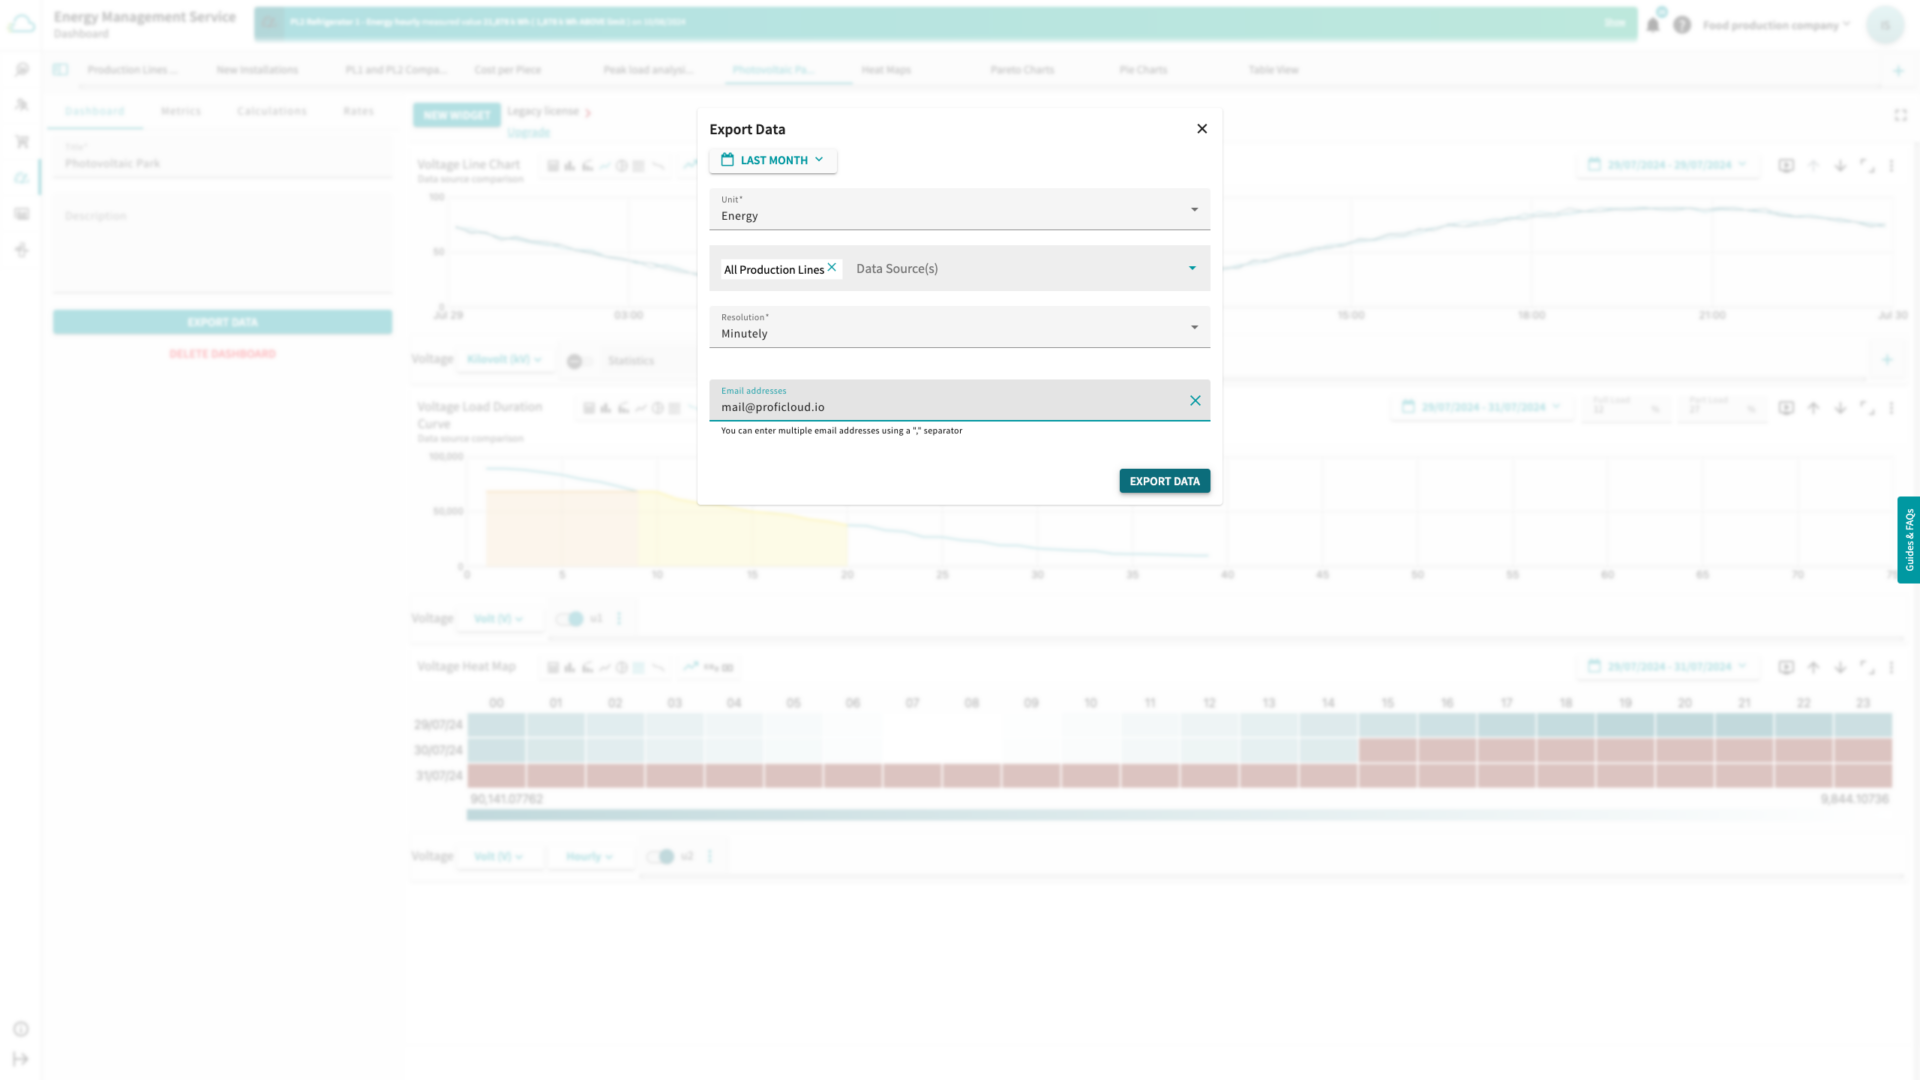
- CSV file of any size can be sent by email as an export option
- Unit types can now be edited
- Clicking on a metric immediately displays the data as a chart, this also works for calculated metrics
- In combination with this, the user can immediately convert the chart into a widget via a button
- Drag & drop works to position a dashboard in the desired order
- The service is now listed on the BAFA website as an eligible software solution
- Revision of the API to improve reliability for the user
Fixed bugs
- Fixed an error when switching between different diagram types
- Fixed a bug in the alert area
- Fixed a problem with the average line in bar charts
- Date selection was not visible under certain circumstances
- Notifications are not cleaned up – fixed
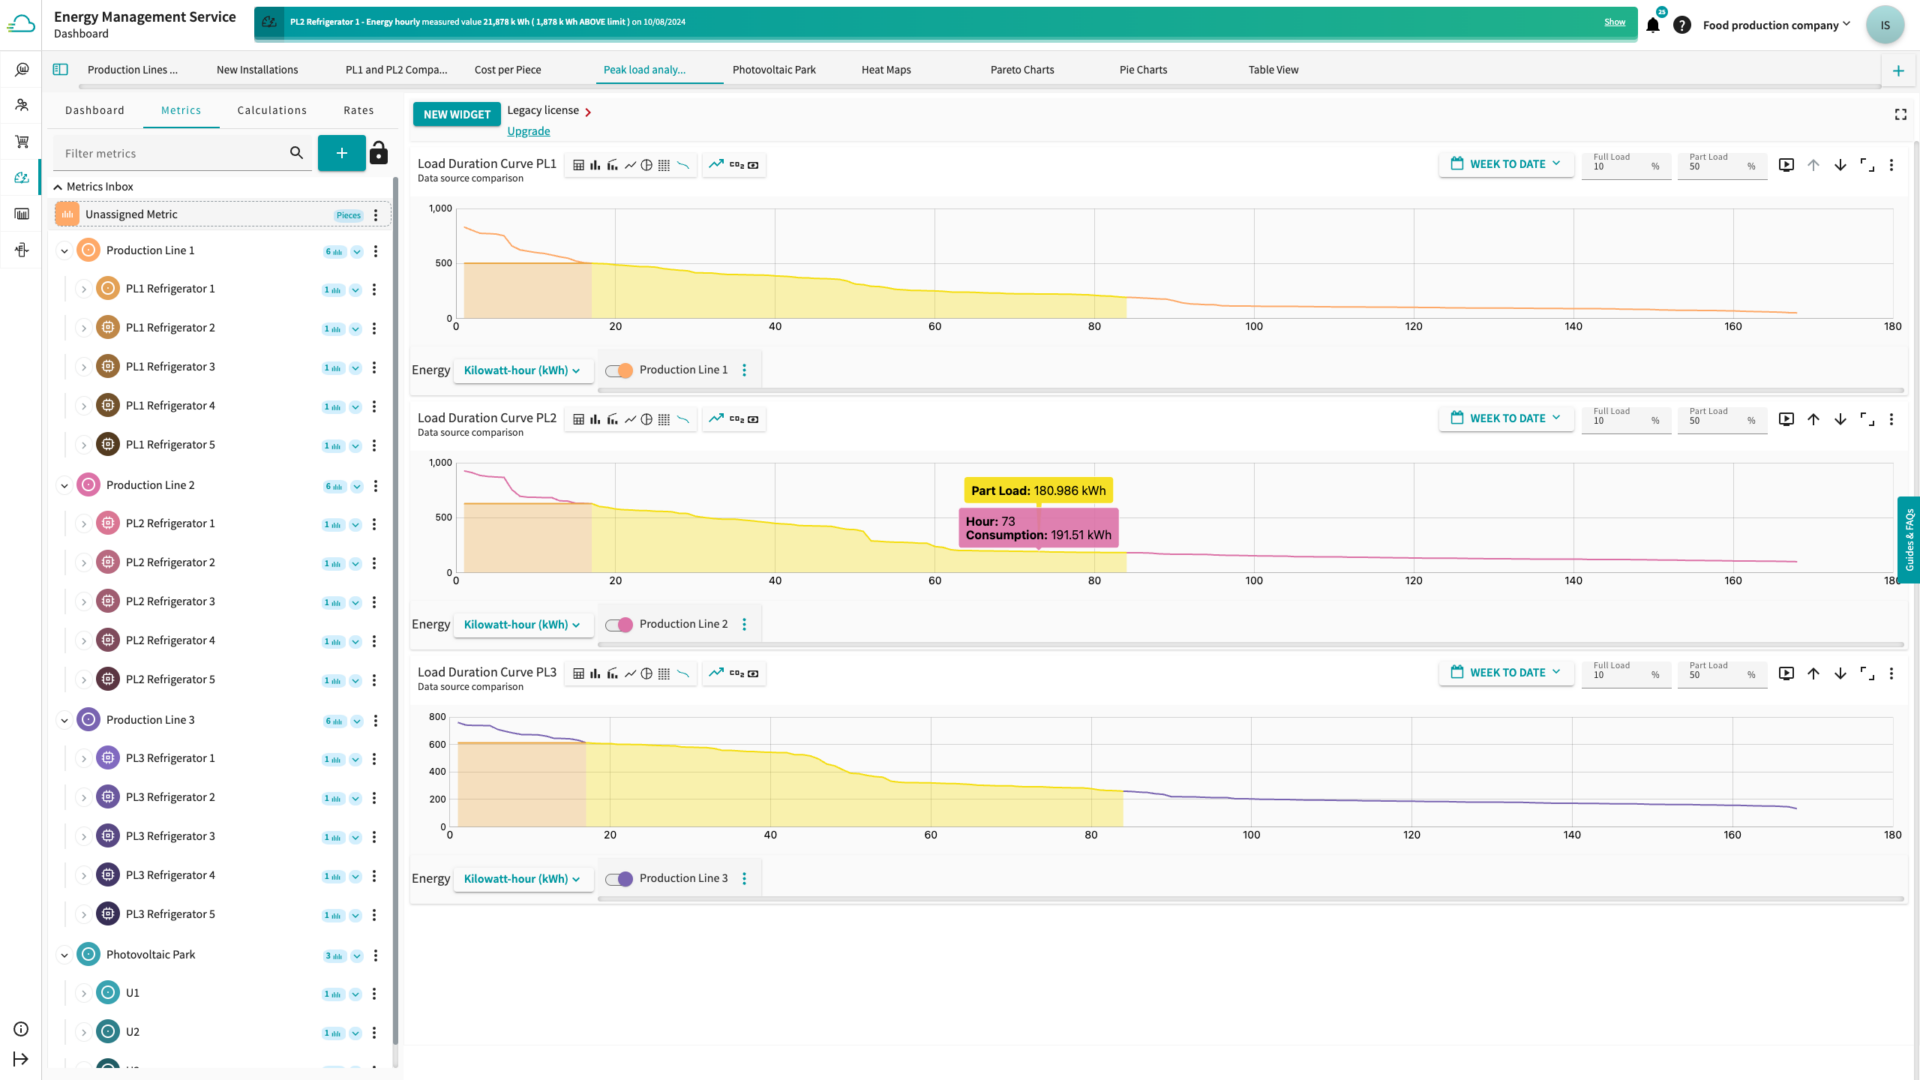
- Load duration curve as a new type of diagram: See for different time scales a sorted power or consumption curve. Mark your partial and your full load in the diagram. It is very helpful for dimensioning of CHP’s or a photovoltaic system.
- Formular editor was improved: It works more smoothly now
- Alerting has a new feature: The alert log consist now of a diagram that shows the point of trigger and around
- Alerting was complete changed under the hood
Fixed bugs
- CSV import issue fixed: Batch upload created an issue – fixed
- Auto scrolling in tree view was broken – fixed
- Cannot change the colour of aggregated metrics – fixed
- Unit typ not show in inbox – fixed
- Alerts for measurements and consumptions are now possible
- Aggregated metrics in the tree view: Metrics of the same utility type will be aggregated automatically to a virtual metric that can be used
- Weather adjustment for different geographical locations: The solution offers via CSV upload to adjust consumptions according to the geo location
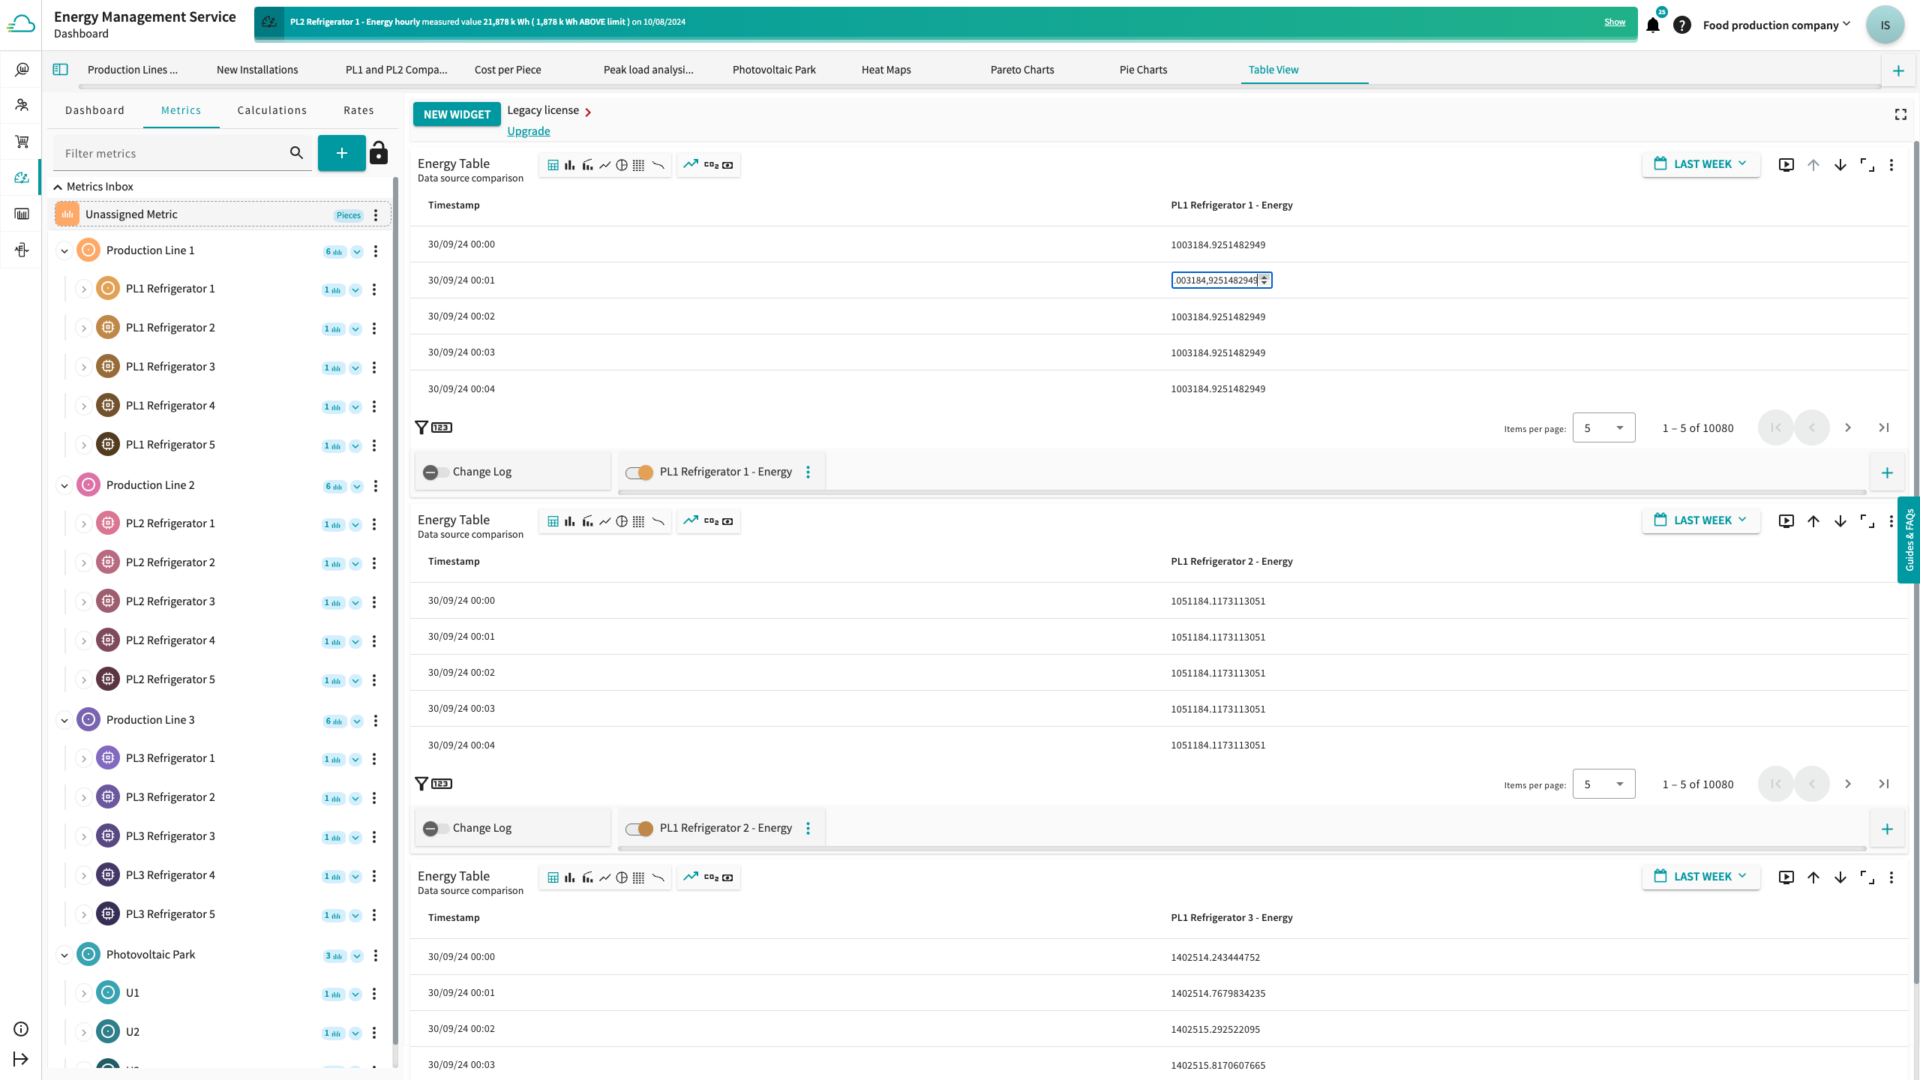
- Log changes in the table view: You can change manually entries of metrics in the table view. Those changes will be logged from now on.
- Find individual units to explain consumption to non-professionals, e.g. Kilowatthours in Energy for no. of cups of coffee
- Alerts can be deactivated
- Due to an improved Data Base usage, we increased the response time by almost 30 percent for bigger chucks of data sets like e.g. of 1 year or month
Fixed bugs
- Some minor bugs solved
- Export via mail link had an issue – fixed
- Table view bugs solved
- Neares data link did not work for a period
- News and improved navigation for widgets introduced
- Widgets can now display data in a full-screen view, making it easier to work without interruption
- The order of the already created widgets can now be customized
- It is now possible to give the widgets individual names, which makes it even easier to customize the Smart Service to your own requirements
- To give the data full space, it is possible to collapse the treeview
- Publicly accessible links can now be created for specific dashboards. Data in this dashboard can be updated automatically every minute
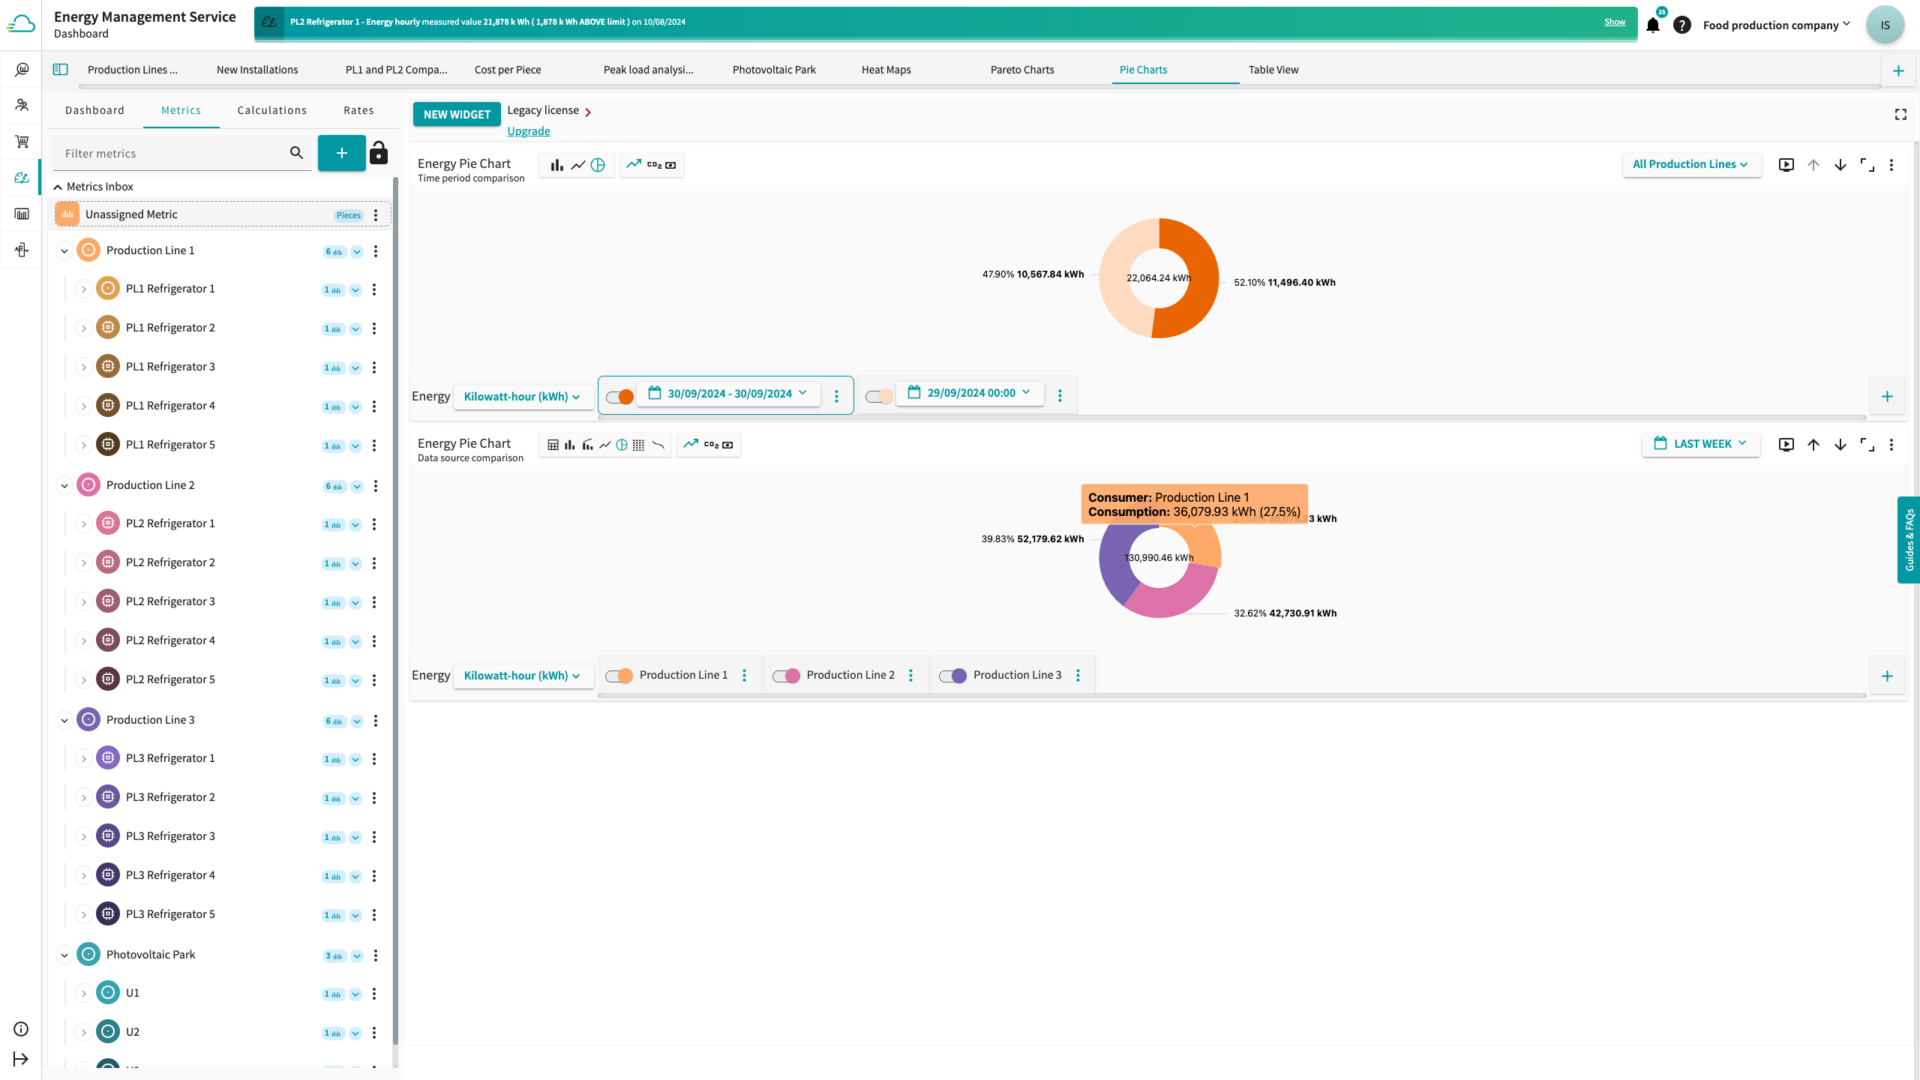
- It is now possible to change the way a widget displays data with one click. It is possible to switch between Line Charts, Bar Charts, Pie Charts, Pareto Charts and Heatmaps
- It is possible to switch from consumption to costs/CO2 emissions
- Navigation to metrics displays chart automatically
- 1 click to bring the automatic chart to your customized dashboard
- Change the unit of the displayed metric directly in the widget, e.g. from MWh to kWh
- Move the mouse pointer over long names to display the full name of e.g. metrics and names
- Virtual metrics in the calculation are displayed in the correct metric units
- The calculation for virtual metrics is editable
- Improved date selection and new position
- Improved drag and drop in the tree view
- Improvements to user-friendliness
- Elimination of problems with tariff calculation
- Table view
- From now on view and modify raw data of metrics in a table
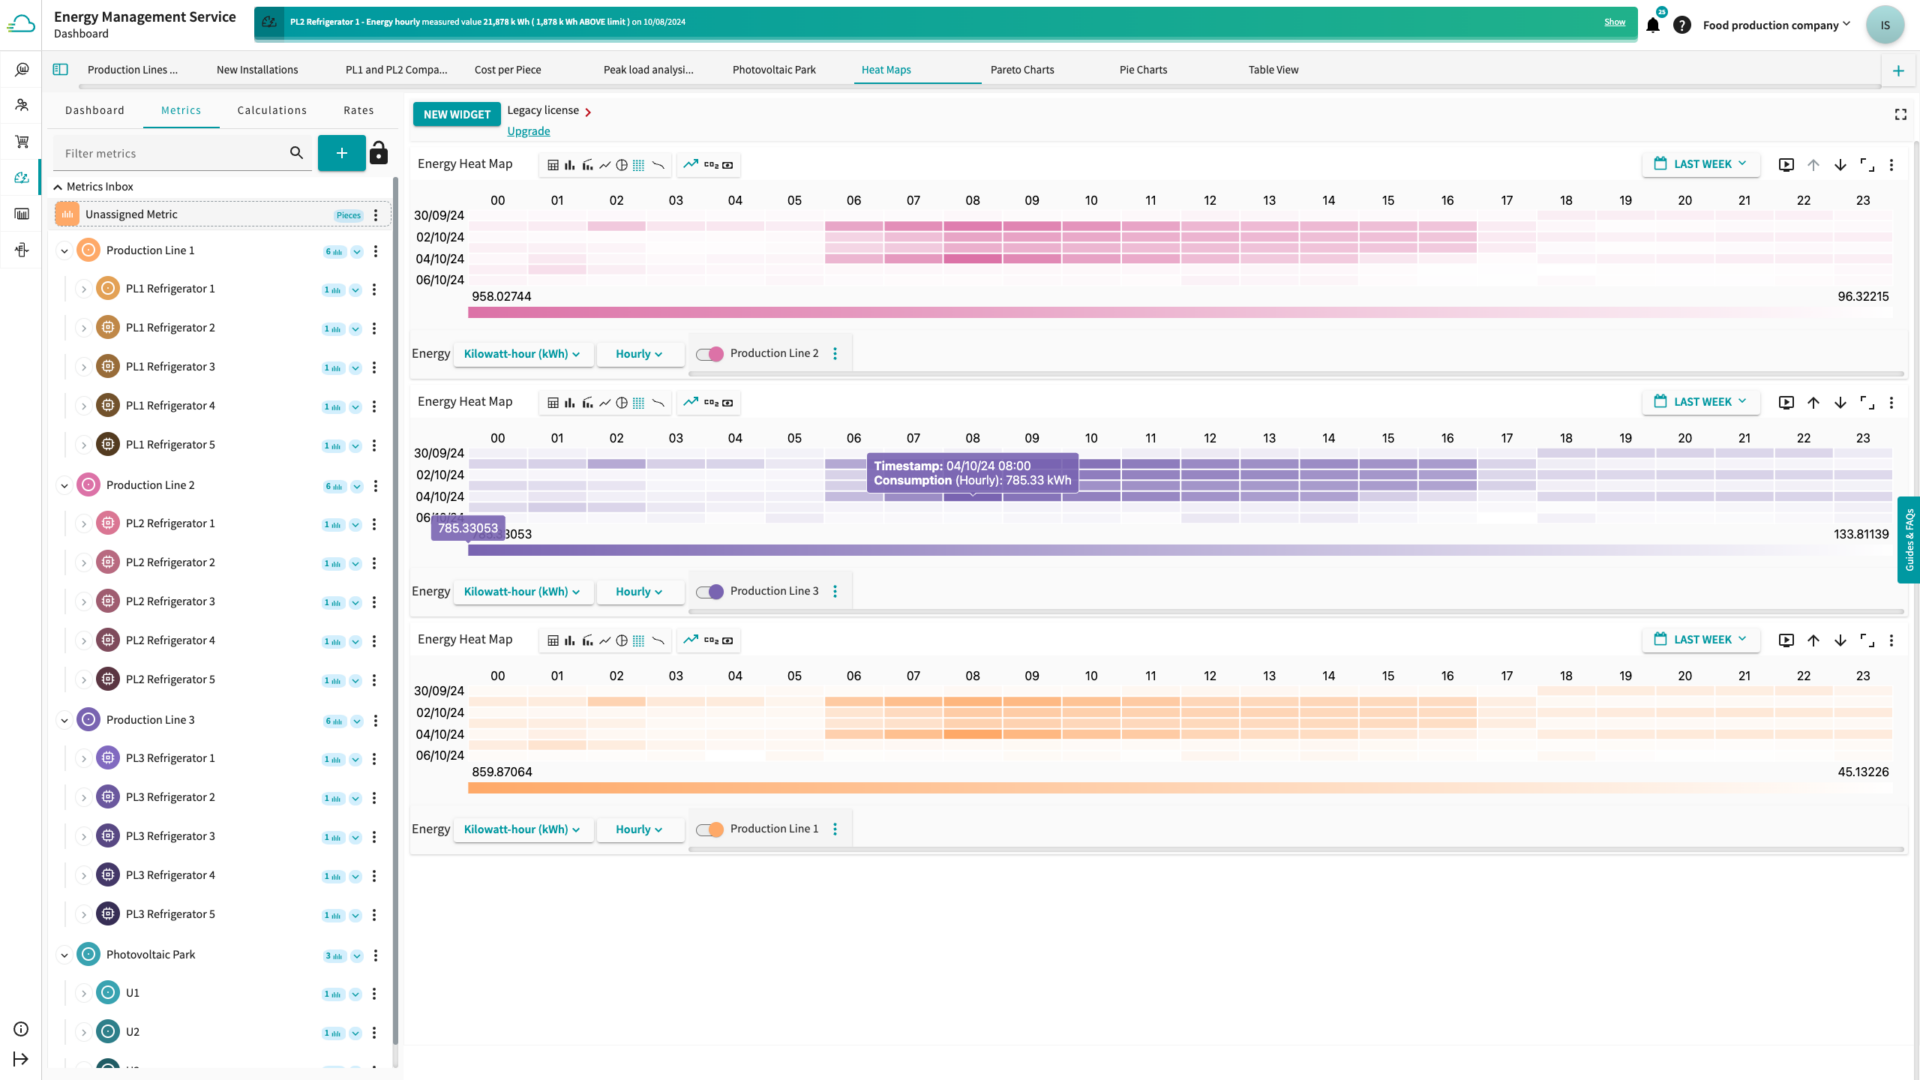
- Heat map
- Introduced a new diagram type to identify patterns or data with issues in consumptions
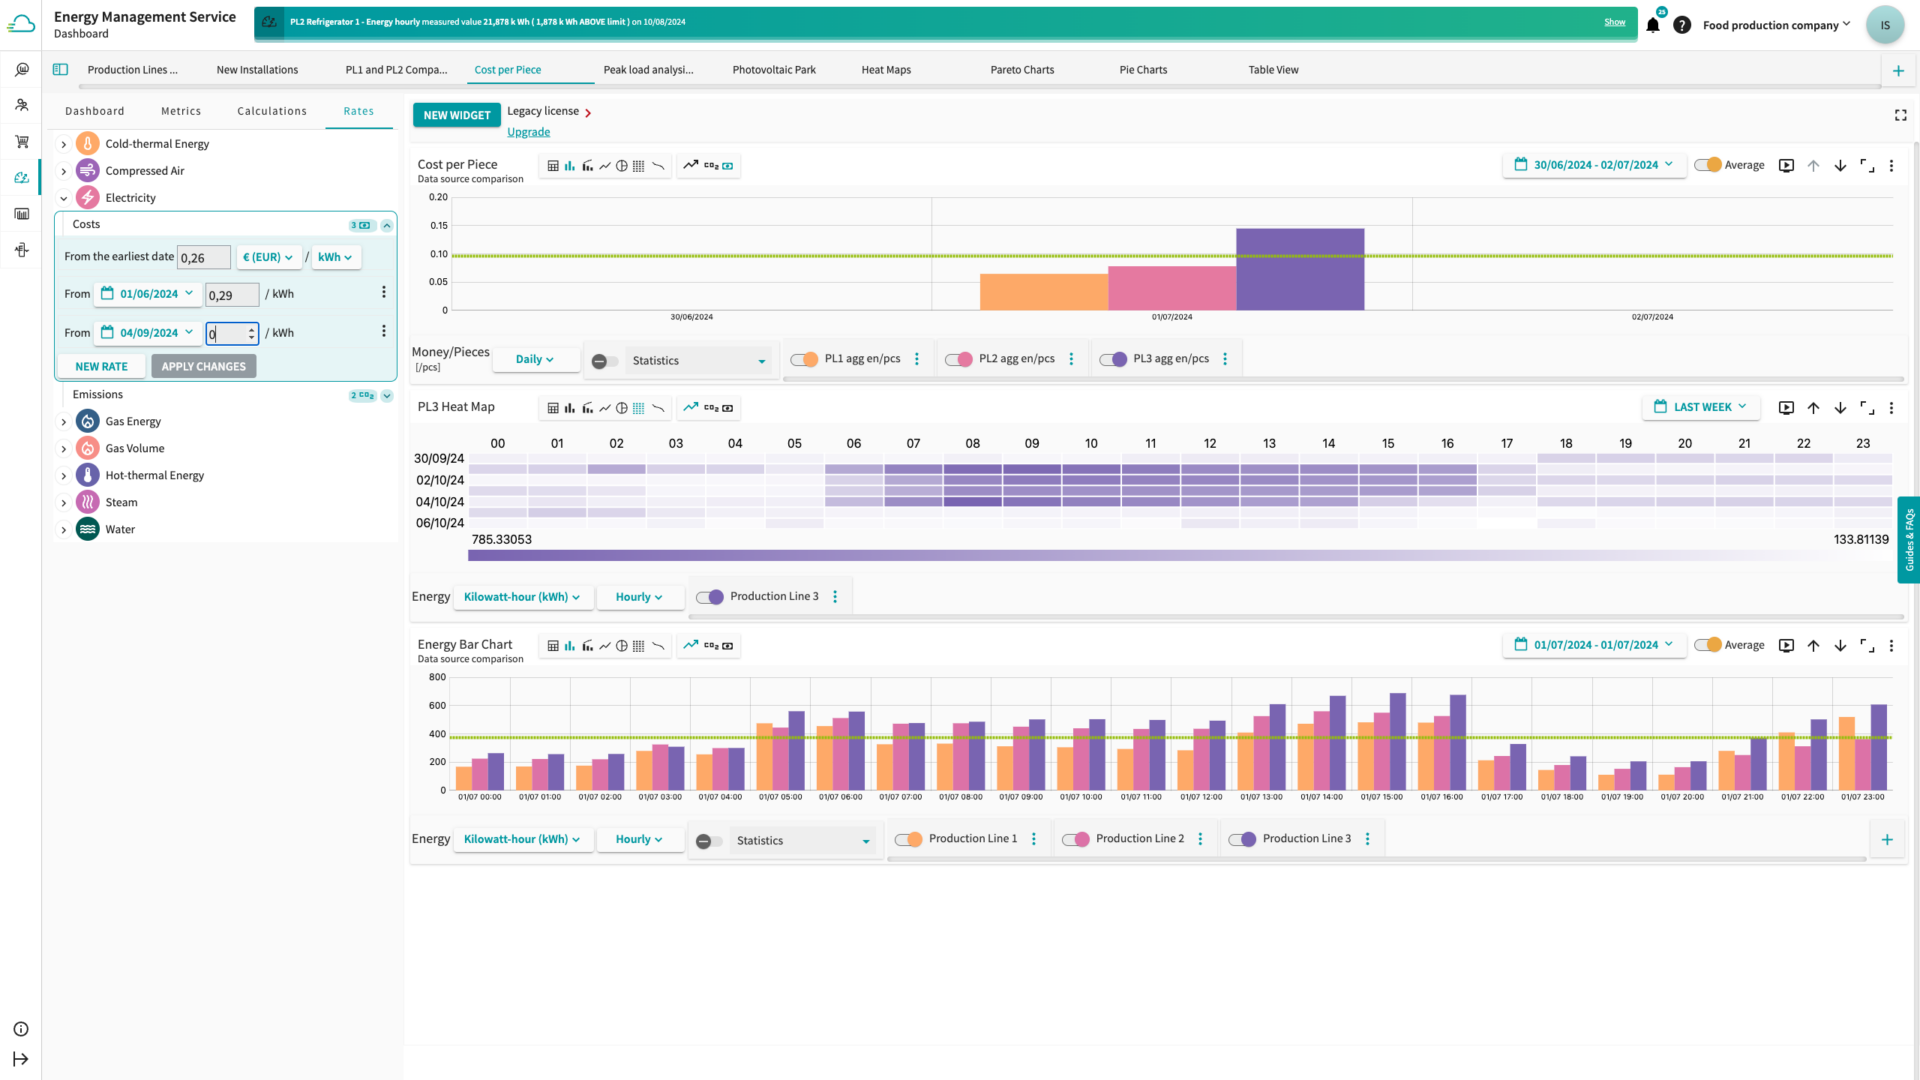
- Cost and emissions (rates)
- A smart way to analyze costs and CO2 for all types of consumption (e.g. gas, water, electrical energy)
- It works out of the box due to default values that can be customized
- Data export via e-mail csv-file download
- For long time periods and high resolution, data export now works via e-mail.
- Different improvements to perform better usability
- From now on it is possible to change widged titels to keep overview of your analytics
- Units of metrics and calculations are visible in tree view and in widgets. That helps to improve the level of organization in the system.
- Improved navigation in tree view
- Introduced a new collapse button for dashboard
- Division into Metering Points (administrative units) and Metrics (actual data)
- Metering Points and Metrics can be nested and thus form a tree view
- Tree view can be used to reflect real properties in the EMMA Service
- Metering Points and Metrics can be moved and sorted via drag and drop
- Metering Points can be collapsed to ensure better clarity
- Every Metric can only be used once in the Metrics overview and in the Metering Points
- Total number of Metrics are displayed on the right side of the Metering Points, clicking on the number allows adding new Metrics to this Metering Point
- Individual names, colors, and icons can be assigned to Metering Points (e.g. map marker, building, sensor, etc.) to create better clarity
- Individual colors and names can be assigned to Metrics
- Summation feature will be discontinued in the future and replaced by automatic summation in Metering Points
- Metrics within a Metering Point are automatically summed up and can be used as a total in dashboards
- New representation for energy meters and calculated meters
- Metrics (values from energy meters) have their own area
- Metric Inbox added, here all unused, available metrics (data flows) are displayed
- Metrics and Metering Points
- Metering points and metrics can be represented in a nested manner, creating a tree view.
- The tree view can be used to reflect real properties in the EMMA service.
- Metering points and metrics can be moved and sorted using drag and drop.
- Metering points can be collapsed to ensure better visibility.
- Improved search feature with autofill and jump to selected entry
- Added possibility of creating new meters as KPIs with different mathematical functions (e.g. meter_1 + meter_2; meter_2 * 0.675 …)
- Individual units can be added to KPI meters
- Improved time picker for dashboards and widgets
- Overall performance improvements
- New media available in the EMMA Service (e.g. Water, Gas, Hot/Cold Thermal Energy, Steam)
- Energy meters can be individualized based on media
- Energy meters can be edited while being used
- Links to last time where data was received
- Minor bug fixes
- Creation of alerts possible
- Different triggers (hourly, daily, weekly) possible
- Alerts are divided into three different levels: Information, Attention, Alert
- Notification inside of Proficloud.io
- Creation of alerts possible
- Different triggers (hourly, daily, weekly) possible
- Alerts are divided into three different levels: Information, Attention, Alert
- Notification inside of Proficloud.io
About the Energy Management Service
The Future of Energy Management
This Smart Service enables remote data access of energy and power data using the IoT-enabled measuring devices of Phoenix Contact in order to monitor, analyse and evaluate this data with the help of diverse visualization options.
Your benefits:
- Save time and improve workflows through remote monitoring and easy-to-understand dashboards that visualize your energy and power data
- Make quicker decisions: Benefit from tailored visualization options for energy and power data analysis and evaluation
- Enable to work safely from remote: View energy data from anywhere at anytime
Screenshots, Tutorials, Videos of the Energy Management Service
Compatible devices
| Device Type | Article Number | Device Management Service | Time Series Data Service | Energy Management Service | ImpulseAnalytics Service | |
|---|---|---|---|---|---|---|
| AXC F 2152 | 2404267 | Controller | 2020.6.1 (or higher) | 2021.0.x LTS (or higher) | 2021.0.x LTS (or higher) | – |
| AXC F 1152 | 1151412 | Controller | 2021.0.x LTS (or higher) | 2021.0.x LTS (or higher) | 2021.0.x LTS (or higher) | – |
| AXC F 3152 | 1069208 | Controller | 2021.0.x LTS (or higher) | 2021.0.x LTS (or higher) | 2021.0.x LTS (or higher) | – |
| RFC 4072S | 1051328 | Safety controller | 2021.0.x LTS (or higher) | 2021.0.x LTS (or higher) | 2021.0.x LTS (or higher) | – |
| EPC 1502 | 1185416 | Edge device | 2021.0.x LTS (or higher) | 2021.0.x LTS (or higher) | 2021.0.x LTS (or higher) | |
| EPC 1522 | 1185423 | Edge device | 2021.0.x LTS (or higher) | 2021.0.x LTS (or higher) | 2021.0.x LTS (or higher) | |
| EEM-SB370-C | 1158951 | Measuring device | 2020.6 (or higher) | 2020.6 (or higher) | 2020.6 (or higher) | – |
| EEM-SB371-C | 1158947 | Measuring device | 2020.6 (or higher) | 2020.6 (or higher) | 2020.6 (or higher) | – |
| IPCH-4X-PCL-TCP-24DC-UT | 1045379 | Pulse measuring device | 3.0.1234.0 | – | – | 3.0.1234.0 |
| BPC 9102S | 1246285 | Safety controller | 2021.0.x LTS (or higher) | 2021.0.x LTS (or higher) | 2021.0.x LTS (or higher) | |
| CHARGE Repay Gateway | 9876543 | 2021.0.x LTS (or higher) | ||||
| CHARGE Repay Gateway | 9876542 | 2021.0.x LTS (or higher) | ||||
| CRG 0001 | 9876544 | 2021.0.x LTS (or higher) |


