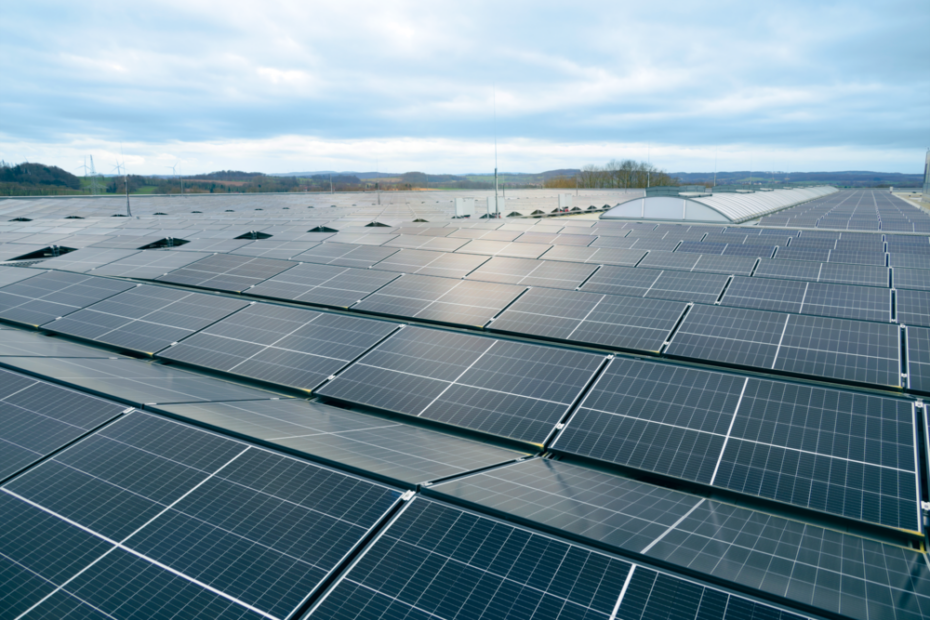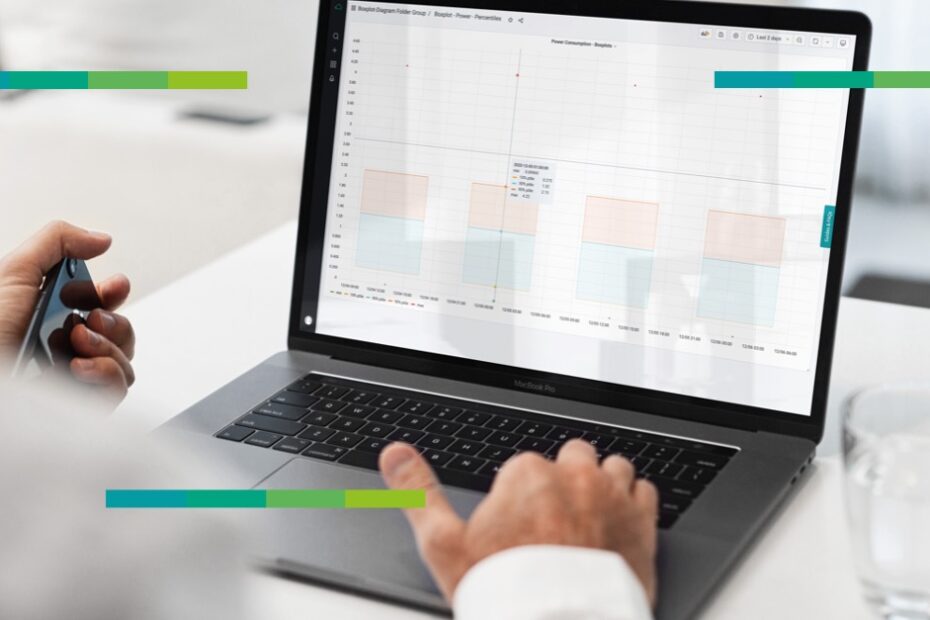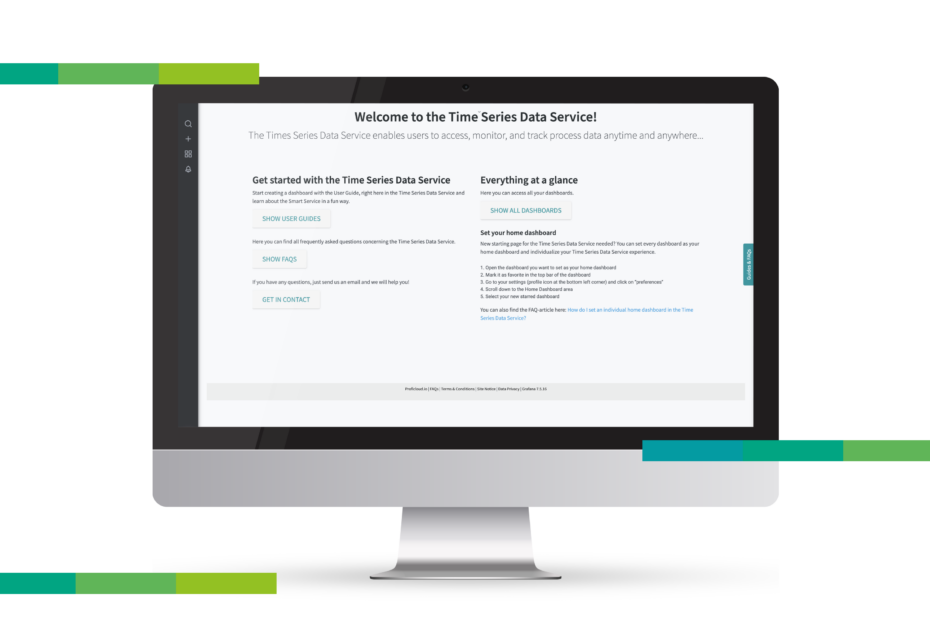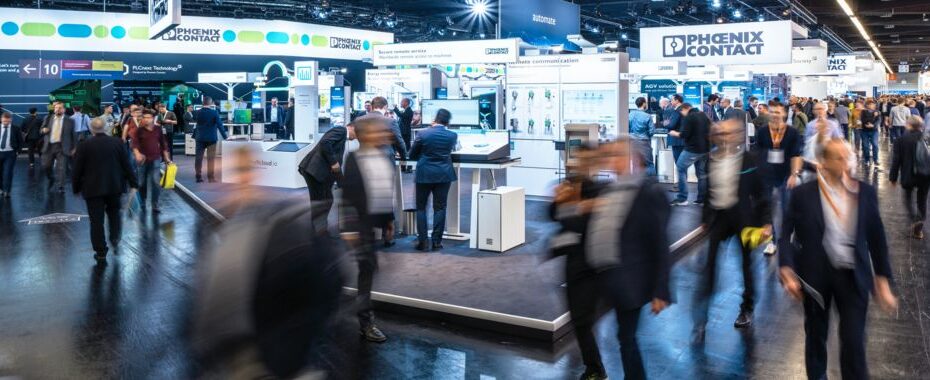
Join us at Hannover Messe 2025: Easy data visualization, energy management and renewable energy solutions
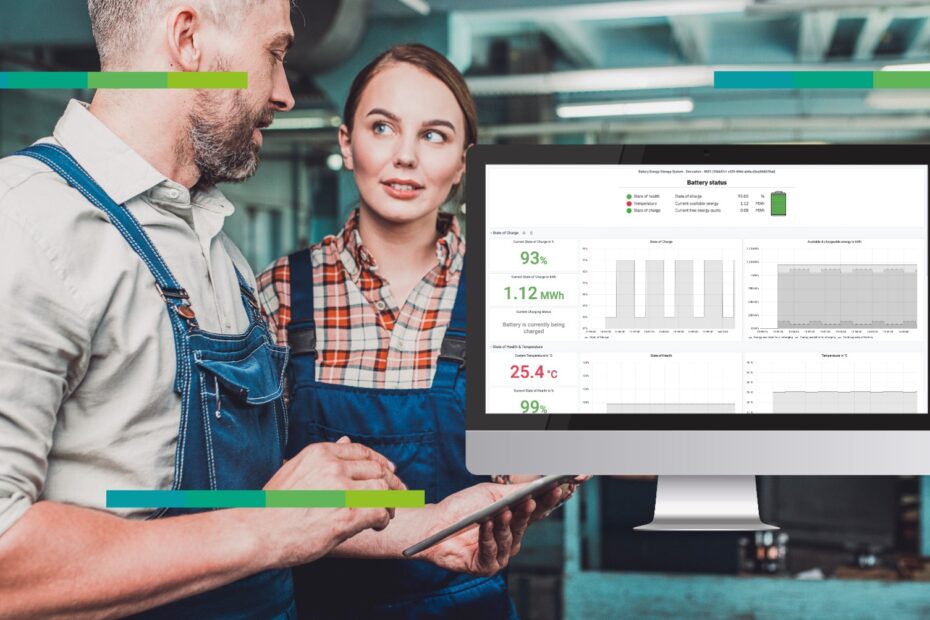
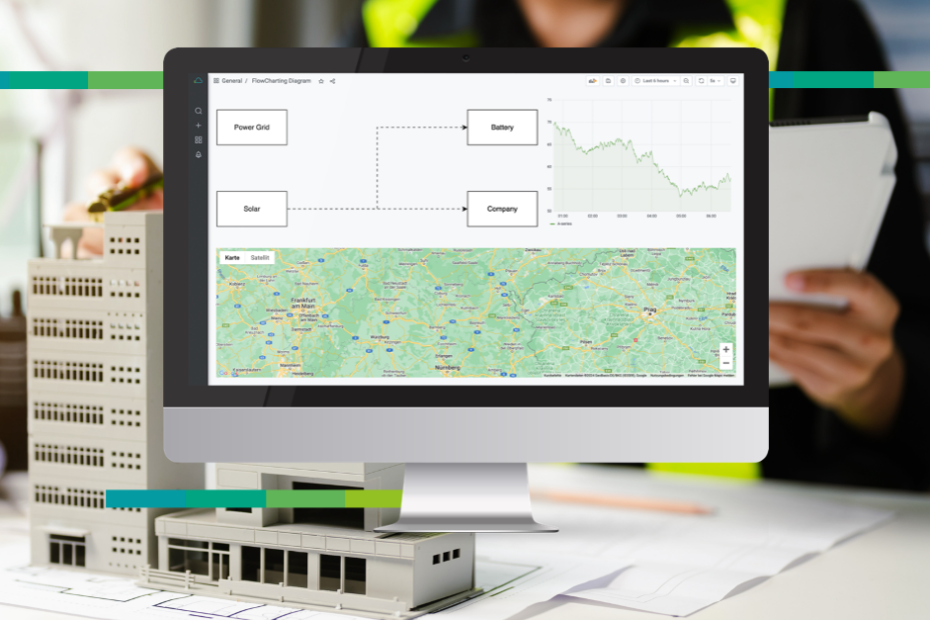
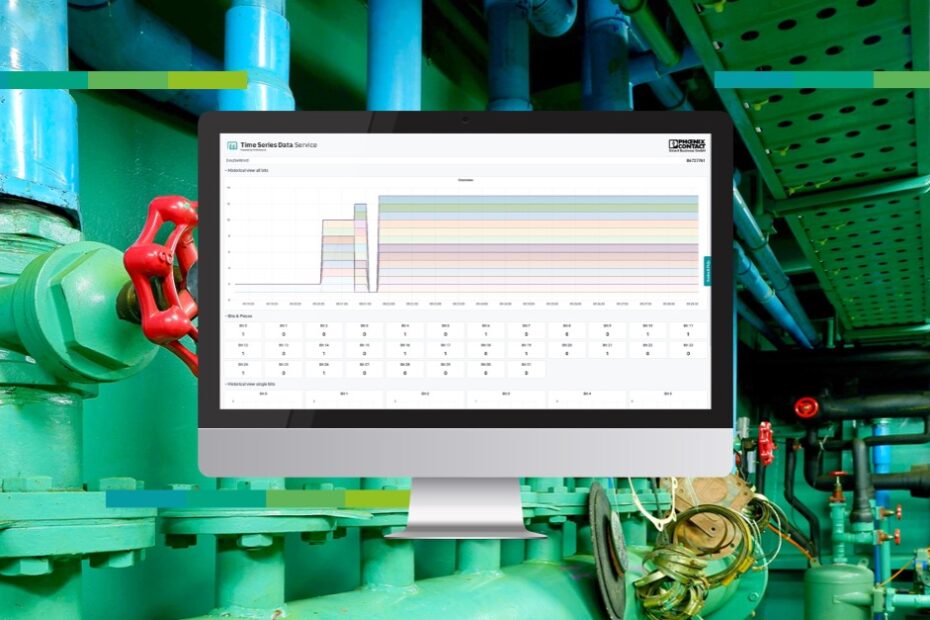
Explore our latest innovations, including the TSD Dashboard Library for effortless data visualization, the Energy Management Service for comprehensive energy monitoring and the Time Series Data Service for data analysis of renewable energy sources.